
Distinguishing Programme Choices
There are two ways of looking at the programme of reforms in P2030: to fund the transformation to Universal Services and all the structural reforms, and to do all of that plus generate extra fiscal space for further national priorities.
The report includes the option to generate revenues for the extra Fiscal Space as a demonstration of what is only possible after the transformation to Universal Services. Reducing the cost of living is what provides the confidence and permission to raise more tax but moving on to generate additional revenues is an opportunity, not a requirement.
Universal Services only, without Fiscal Space
If taxes are set to just fund the reforms then 59% of households are better off, accounting for the value of the Universal Services and the increases in incomes tax.
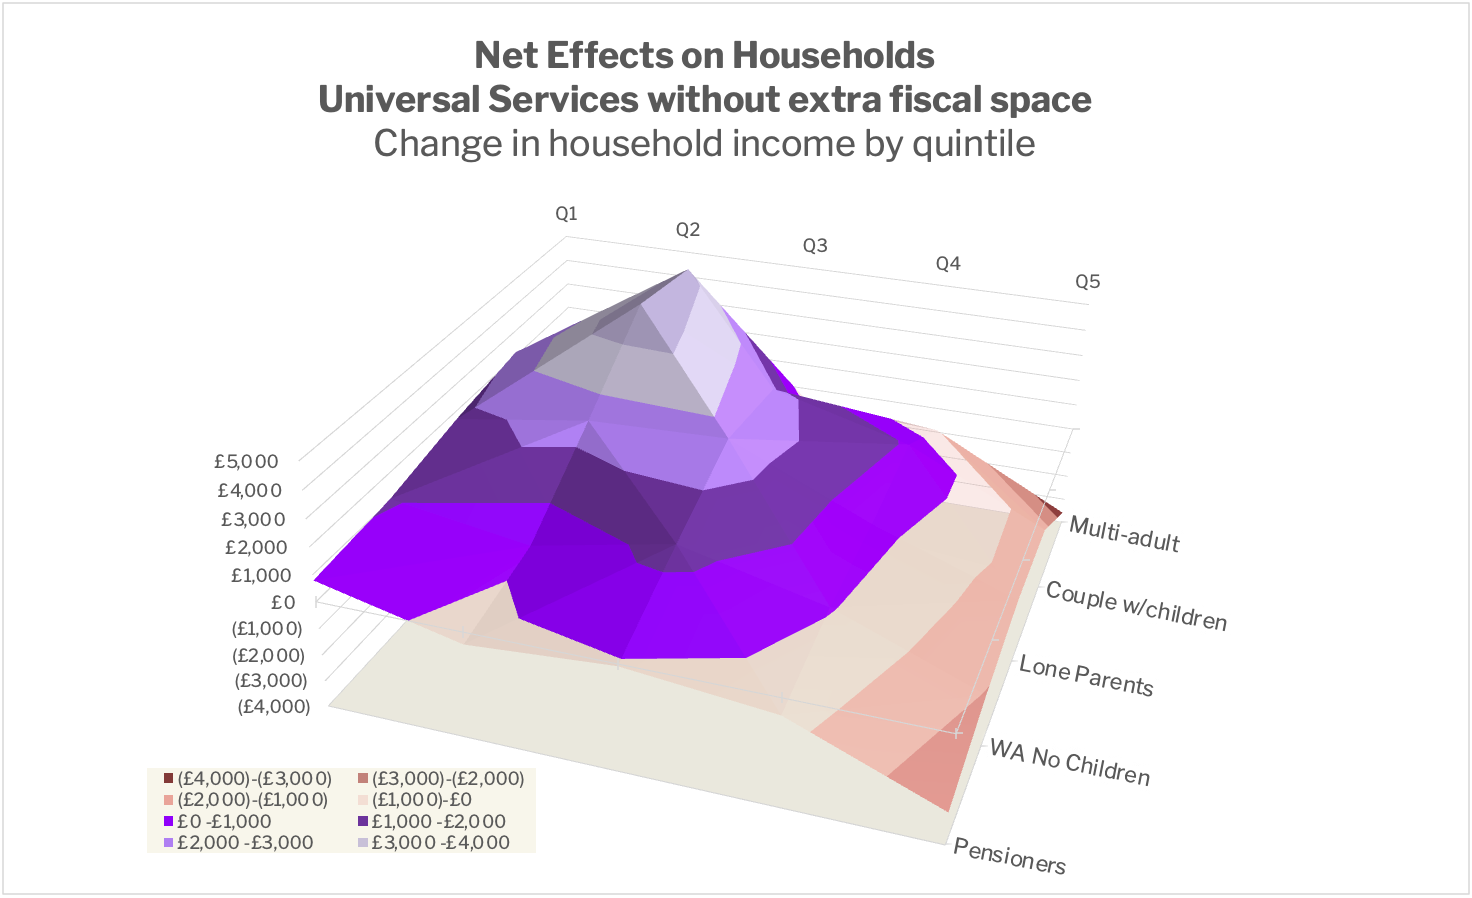
The average additional net contribution from the top quintile is 2.7% of income, equal to £45 a week (£2,300/year) after reductions in cost of living, modelled on minimal take up of the available Universal Services. If the top quintile households make the same savings as the second quintile, they would recoup half of their extra contributions.
With Fiscal Space (P2030)
With taxes set to rates that generate extra fiscal space, as presented in the report as the base configuration of National Contributions, 44% of households are better off overall, accounting for the value of the Universal Services and the increases in incomes tax needed to generate the extra fiscal space.
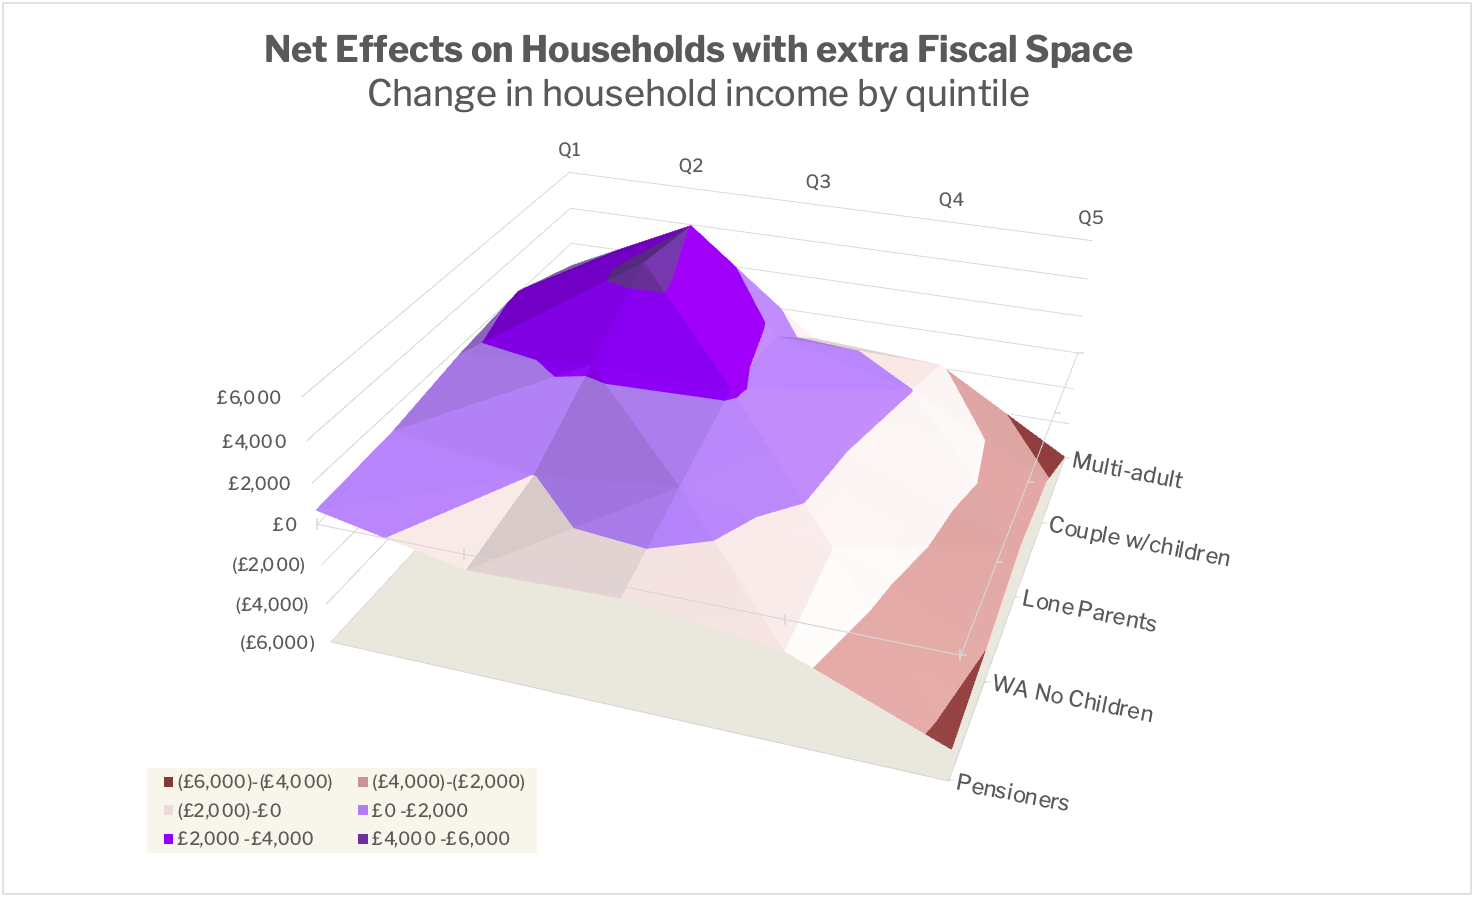
The average additional net contribution from the top quintile is 4.4% of income, equivalent to £83 a week (£4,300/year), or an extra £38 a week more than needed to cover the Universal Services.
As you can see in this table, raising the extra money has the most impact on households in Q4 (average income £40,000) so that nearly all become net contributors, compared to the majority being net beneficiaries when only the Universal Services are included (US Only column in the table).
Comparing Better Off Households across scenarios
| Quintile | US Only | With Fiscal Space | Change |
|---|---|---|---|
| Q1 (Bottom) | 100.0% | 100.0% | unchanged, fully protected |
| Q2 | 61.5% | 45.5% | −16pp |
| Q3 | 77.0% | 63.8% | −13pp |
| Q4 | 54.5% | 5.1% | −49pp |
| Q5 (Top) | 0.0% | 0.0% | net contributors by design |
| All Quintiles | 59.3% | 44.2% |
P2030 with Fiscal Space
Winners & Losers
By household type, families will benefit most from the P2030 programme after including all Services and taxes, and applying NC to taxable cash benefits. Lone parent families standout because three-quarters are in the lowest two income quintiles, and they are modelled with higher take up rates of the Services. Whereas, one-third of Multi-Adult households are in the top income quintile, mostly with more than two full-time workers.
Net Effects: Winners & Losers by Household type
| Household Type | % Better Off | % Worse Off | Net £/HH |
|---|---|---|---|
| Pensioner Households | 28.5% | 71.5% | (852) |
| Working-Age (No Children) | 44.2% | 55.8% | (873) |
| Lone Parent Families | 89.3% | 10.7% | 1,249 |
| Couple Families with Children | 55.2% | 44.8% | 310 |
| Multi-Adult Households | 22.6% | 77.4% | (2,299) |
| All HH Types | 44.2% | 55.8% | (507) |
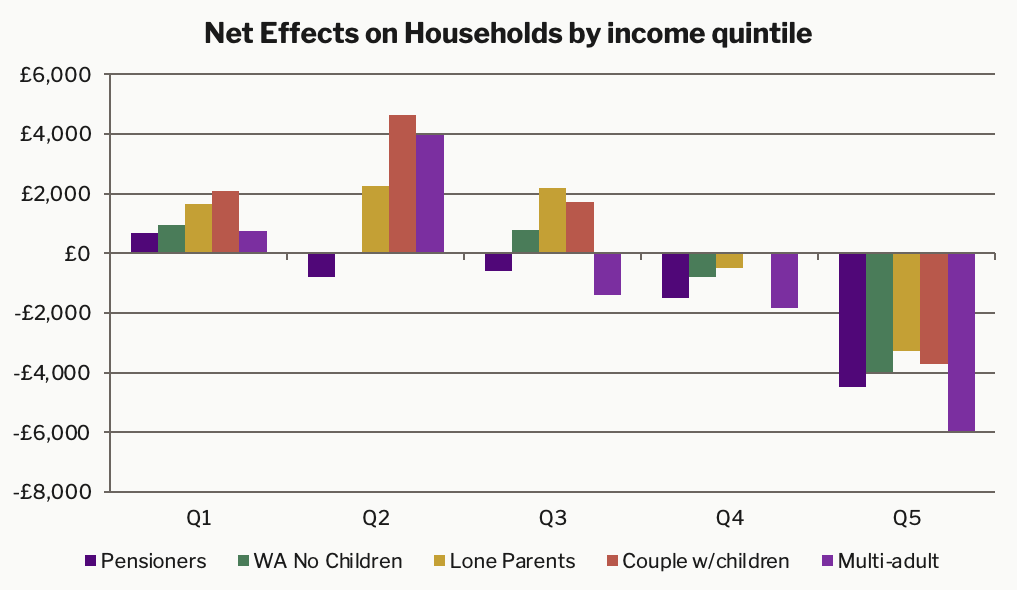
The programme’s net effects are unambiguously progressive across the full range of household incomes. Q3 (full time at minimum wage) households benefit the most because wages are taxed less with NC.
Net Effects: Winners & Losers by Income quintile
| Quintile | % Better Off | % Worse Off | Net Effect (£/HH) |
|---|---|---|---|
| Q1 (Bottom) | 100.0% | 0.0% | 1,037 |
| Q2 | 45.5% | 54.5% | 825 |
| Q3 (FT MW) | 63.8% | 36.2% | 576 |
| Q4 | 5.1% | 94.9% | (884) |
| Q5 (Top) | 0.0% | 100.0% | (4,303) |
| All Quintiles | 44.2% | 55.8% | (507) |
Overall, the households with incomes in the lower two thirds of the national range (less than £33,000) have positive net outcomes. For all households with incomes above that, the net effect is a higher contribution. This is not surprising for a policy configuration that generates a fiscal surplus of £38 billion a year. This is not so much a feature of the distributional interactions of this programme’s welfare policies, as it is a consequence of increasing tax revenues by 1.4% of GDP to fund other priorities.
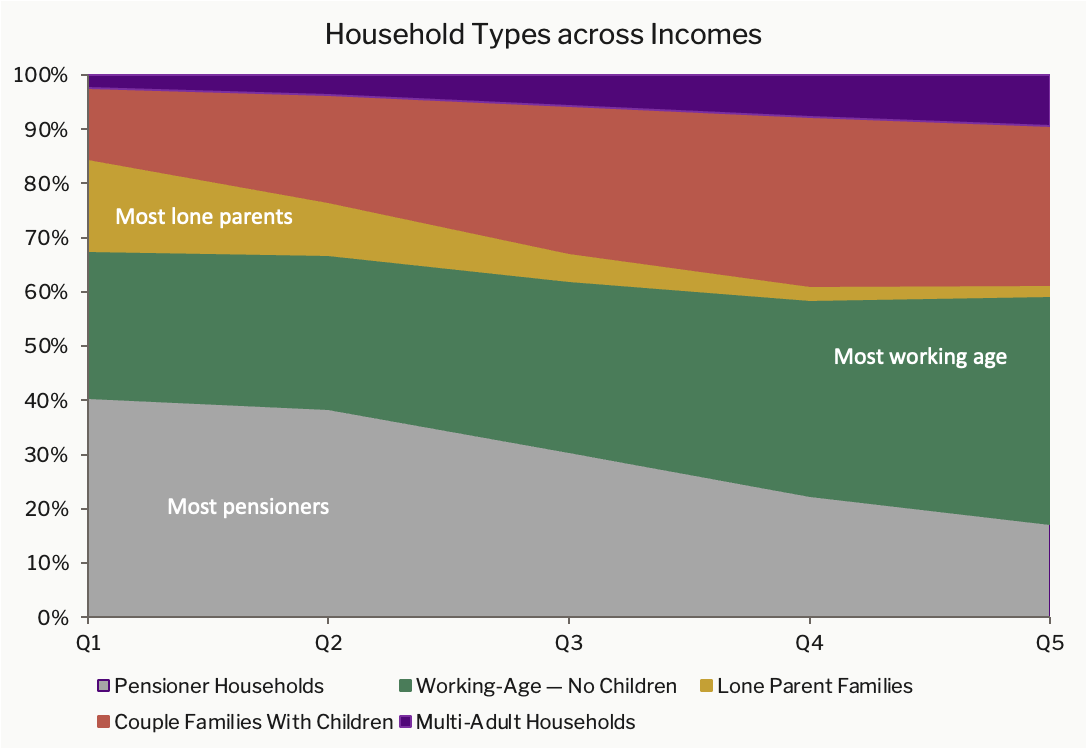
Household Distribution across Incomes
When reading across household types it is important to keep in mind that while the number of households in each income quintile are equal, the portion of household types in each quintile vary considerably over the income range, as shown in this diagram.
Example Family
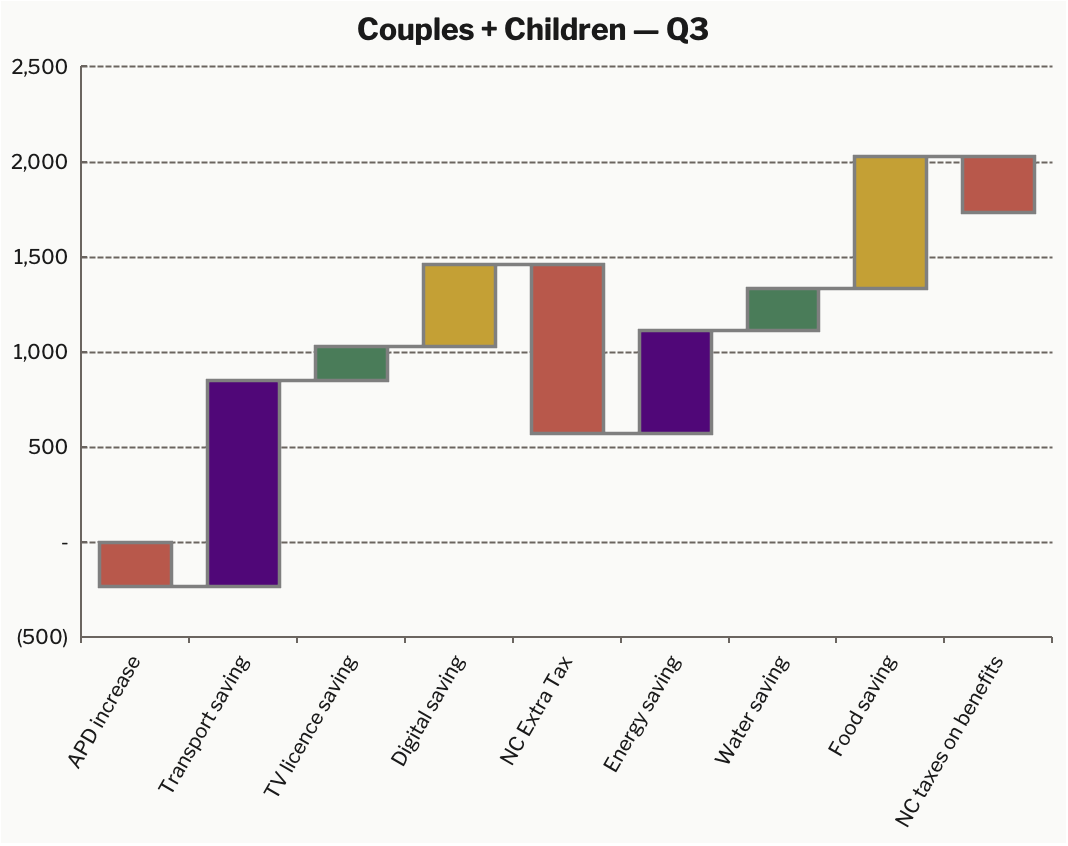
This chart shows the progression of an average family with children and a household income of about £27,000 a year through the P2030 programme. At the end of the first year they are up about £1,030, and after the Services and NC start from Year 2 they are saving about £2,030 a year compared to the current system. By the end of the programme they have settled at around £1,735 a year better off as NC on benefits phases in.
This analysis is completed for 13 household types across all five income quintiles. The results are then consolidated by the 5 main household types for presentation in the appendices.