This article compares National Contributions as a tax system against the current system. It is not an evaluation of the overall effects of the P2030 programme, which is analysed in the next article.
Revenue Neutral
To show how National Contributions (NC) taxes differ from the current tax system, a model that generates the same revenue from both systems is used: a “revenue neutral” configuration. This version of the model assumes no revenue from NC on benefits.
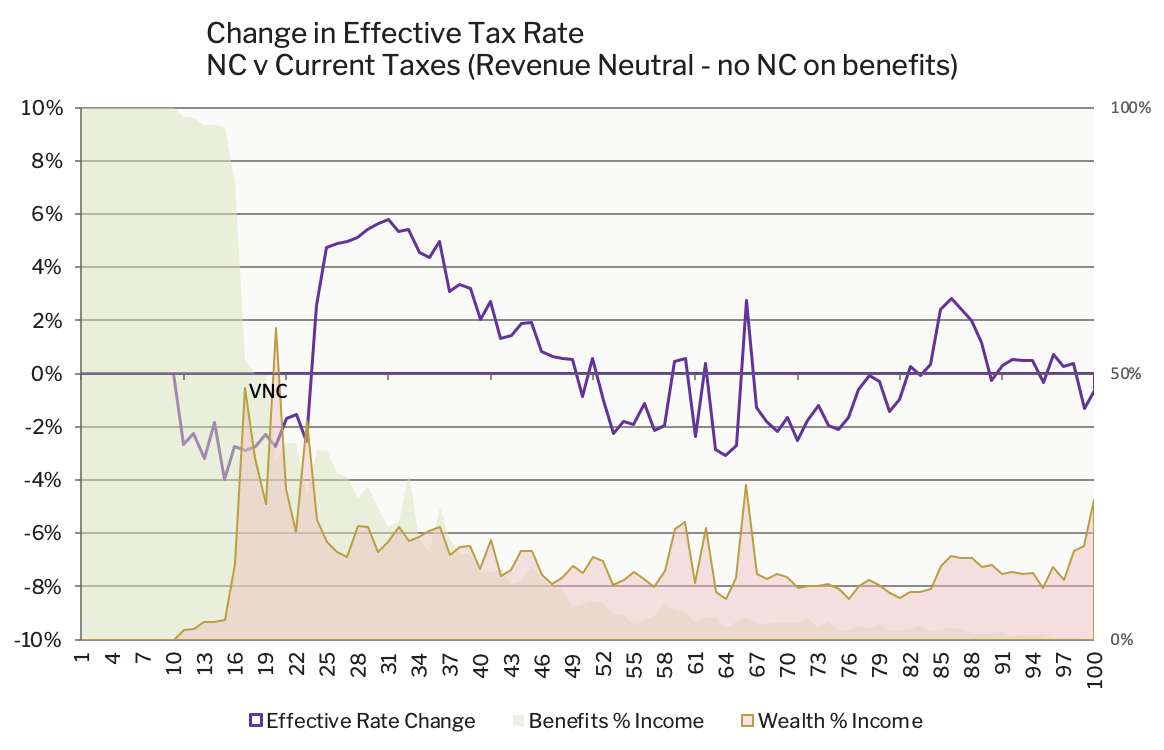
Overall, including all forms of income, 45% have lower taxes, 45% higher taxes and 10% unchanged in a revenue neutral setting with NC compared to current taxes. Those who pay less are concentrated in the band between £26,000 and £46,000 a year of total income. Those who pay more are the people with larger total incomes, particularly where a large share of that income comes from sources the current system taxes more lightly than wages.
NC Lowers Taxes on Wages
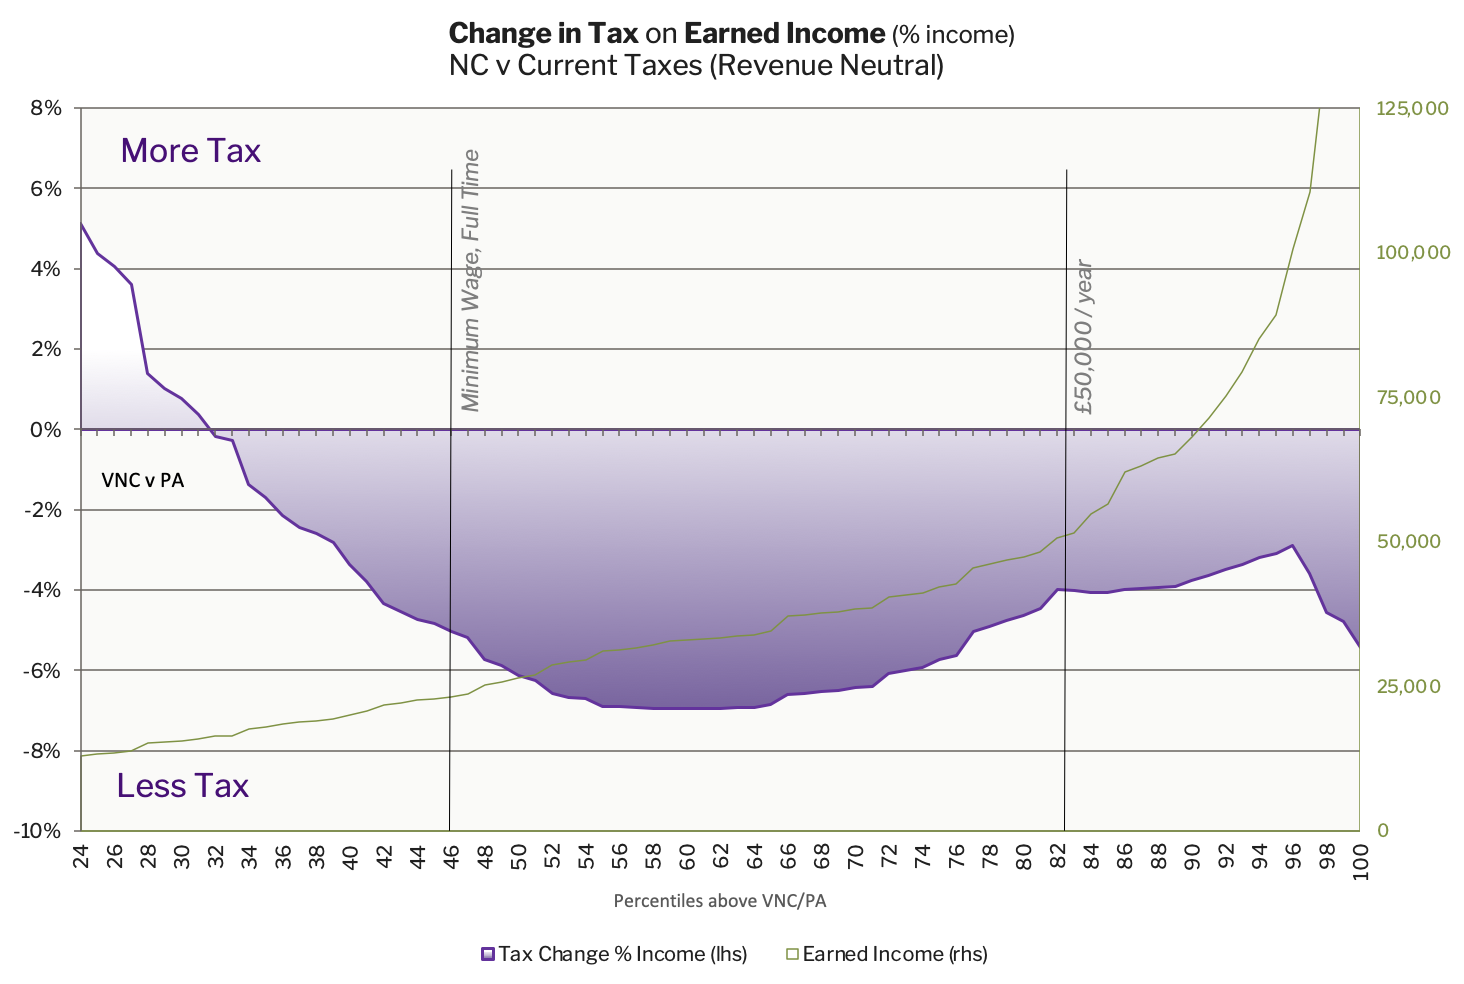
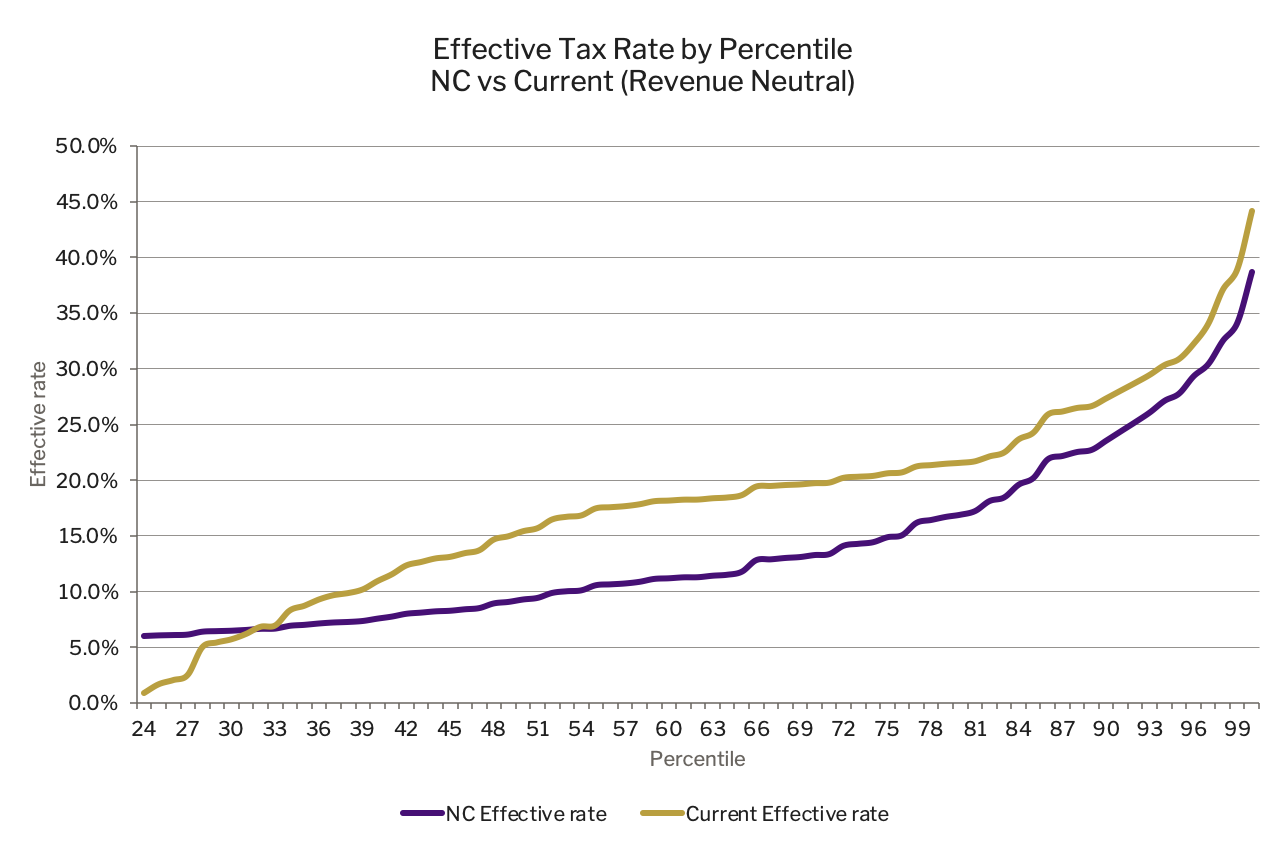
In this chart, we can see that taxes for those with earned income only (wages and self-employment) are lower than under the current system for most workers and 100% of full time workers.
Effective Rate on Wages
The chart below shows the effective rate of tax paid for earned incomes above full-time minimum wage, showing that NC rates of tax on earnings are consistently lower than current Income Tax plus Employee NICs once the current Personal Allowance effect has phased out at around the 32nd percentile (£16,000 income in 2025).
VNC v PA
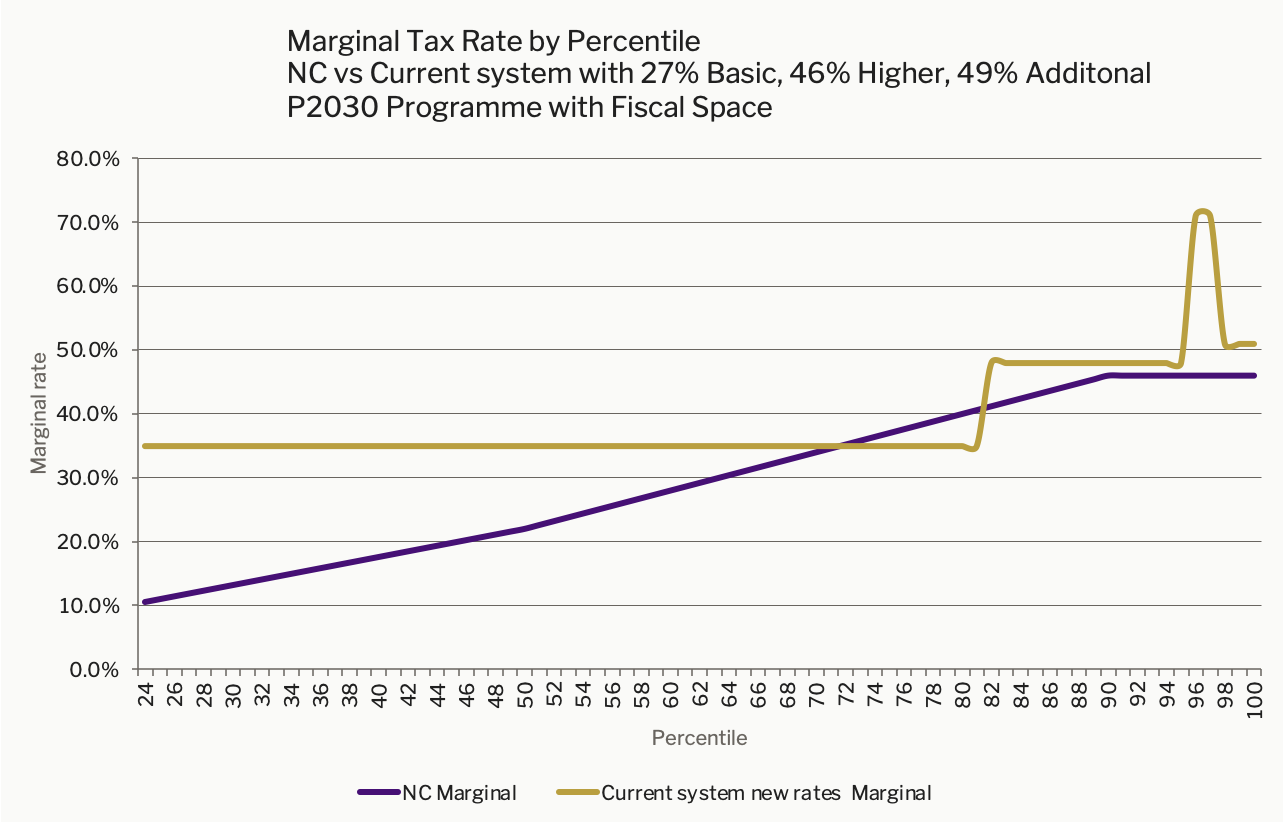
There are some incomes just above the current Personal Allowance (£12,570 a year) who would see higher taxes compared to the current system because there is no tax-free Personal Allowance, so when income exceeds the VNC threshold in NC, tax on all income is due. The marginal rate of tax on each £1 earned over the threshold is much lower with NC for this same cohort, reducing the friction for earning more than the threshold.
For everyone in a full-time job, without any other income, taxes are lower with NC than the current system.
Unearned Incomes
NC taxes all incomes equally, so incomes from unearned income are taxed at the same rates as earned income. Whereas the current tax system applies lower rates to incomes from unearned sources, like capital gains, dividends, and inheritances.
The clearest way to see this is to compare the tax each taxpayer pays with the share of their total income that comes from sources other than wages, which the current system taxes more lightly. The chart shows that the larger that share, the larger the increase under NC, because NC applies a single rate, set by total income, equally to every source.
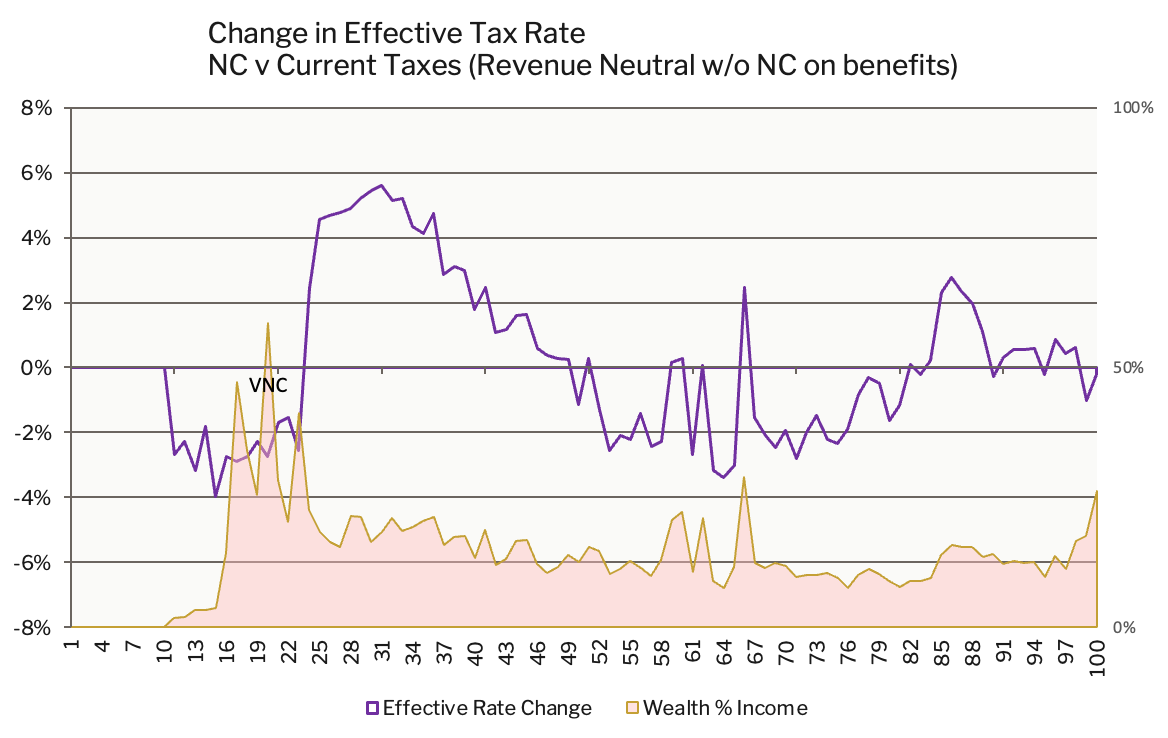
Those with lower taxes, even counting average unearned incomes, are concentrated in the income range for service workers who are the backbone of society, including:
- NHS nurse
- Primary school teacher
- Police constable
- Firefighter
- Paramedic
- Social worker
- Prison officer
- Electrician
- HGV driver
- Bus driver
See also the P2030 Wealth Effects appendix linked in the Related section below..
Relative effects
While more people have lower taxes with NC than the current system in a revenue neutral scenario, the effects of NC differs across four groups of incomes.
The bottom income quarter is protected under NCs, with only voluntary remittance because total incomes are below £12,570. Half of this group only have benefit income, and the other half get up to 50% of their income from wealth. The VNC threshold shelters more unearned income for this lowest income group than the various allowances in the current system.
The second group, with annual income between £13,000 and £25,000, get between half and a quarter of their income from benefits and wealth. For this group, NC taxes average 3.3% more than the current system. The increase averages £600 a year.
The third group, represents everyone working full-time and earning minimum wage to double the minimum wage, comprising the majority of people working in services from nursing to retail with annual incomes from £25,000 to £50,000. For this group, taxes are reduced. They pay about 1.2% less on average, saving about £400 a year on average. For those whose income includes more from sources the current system taxes lightly, that saving is smaller, because NC applies one rate, set by total income, to every source.
Those in highest income quintile, above £50,000, contribute about the same as they do in the current system.
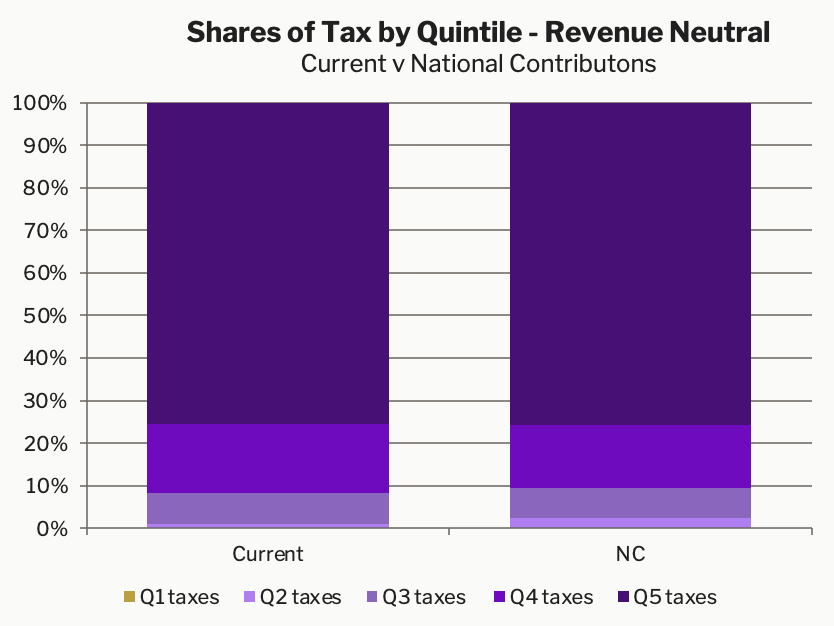
The result is a marginally broader tax base, with higher contribution from taxpayers in the second quintile and less from taxpayers in the third and fourth quintiles, as a portion of total revenues. (The results are sensitive to the shape of the rates selected to generate equal total revenue, with a range between 1% and 2% of total revenue.)