
Net effects of the Prosperity 2030 programme on household income, by household type and income quintile. This headlines view summarises the main distributional findings; a companion appendix carries the full grid of waterfalls for all household types at each quintile.
Net effect of the P2030 services and contributions architecture on five household types across five income quintiles. Steady-state figures, in £ per household per year.
Scope and method
The figures include: NC on earned income; NC on benefits (the parallel charge on working-age benefits); APD increases; and household-level savings from six universal services (Transport, Information, Digital, Energy, Water, Food). They exclude: Property Tax (homeowners only, scoped separately); housing investment, social care, and the hospice/Right to Life programme.
Household groups consolidate thirteen disaggregated sub-types (Single Pensioner, Partnered Pensioners, Single WA, WA Couple, Lone Parent + 1/2/3 children, Couple + 1/2/3/4 children, Multi-adult, Multi-adult + 1 child) into five categories by simple arithmetic mean. Quintiles are based on the household's position in the relevant income distribution for its type.
Phase-in: Transport and Information in Year 1; NC, Digital and Food in Year 2; Energy and Water in later phases. The Benefits NC component is tapered over three years. Figures here show the steady-state position once all components are bedded in.
Take Up
The effects depend substantially on modelling decisions about the take up of the Universal Services. In practice, behaviour will vary between households with the same profile and income depending on their decisions about how often to use the Services, how some of the Services are deployed locally, and over time as the Services scale up.
The results presented here can only be indicative as they are based on subjective assignments of behaviour to cohorts that will contain large variations in practice.
Net effect across all twenty-five cells
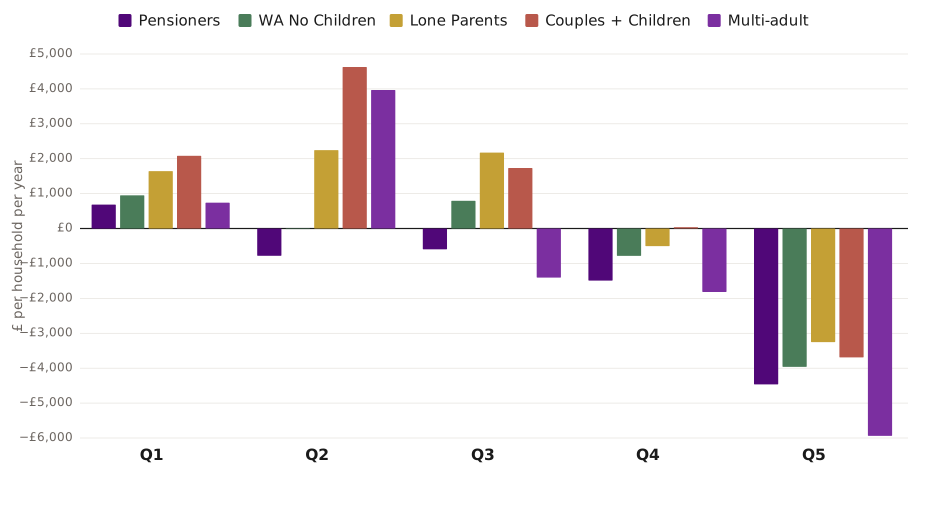
The chart reads as a progressive distributional architecture. The bottom 60% of households (Q1 to Q3) are mostly net beneficiaries. The top 40% (Q4 to Q5) are mostly net contributors. The crossover happens between Q3 and Q4 for most household types, and earlier (Q1 to Q2) for pensioners.
Two patterns deserve naming. First, pensioner households are the least-favoured group at every quintile. They receive zero Transport saving (already on free buses), their Energy savings shrink faster as incomes rise (Partnered Pensioners at Q5 are net contributors to Energy at −£241), and NC applies to pension income exactly as it does to wages. They are the only household type net negative at Q2.
Second, multi-adult households have the steepest gradient from gain to loss. The biggest single gain in the matrix is Couples + Children at Q2 (+£4,627), but Multi-adult at Q2 is close behind (+£3,969), and Multi-adult at Q5 is the deepest single loss (−£5,940). The reason is structural: the savings stack scales sub-linearly with adults (Water is universal per household, Energy is largely per household with variation between sub-types), while NC scales with each adult's income.
Median household (Q3) waterfalls
The five charts below show the line-item composition of the Q3 result for each household type. Q3 is the median household in its category. Colours reflect programme category: coral for taxes, sage for substitutions of existing private spend by universal services, gold for new services, indigo for the Net total.
Pensioners (Q3): −£596
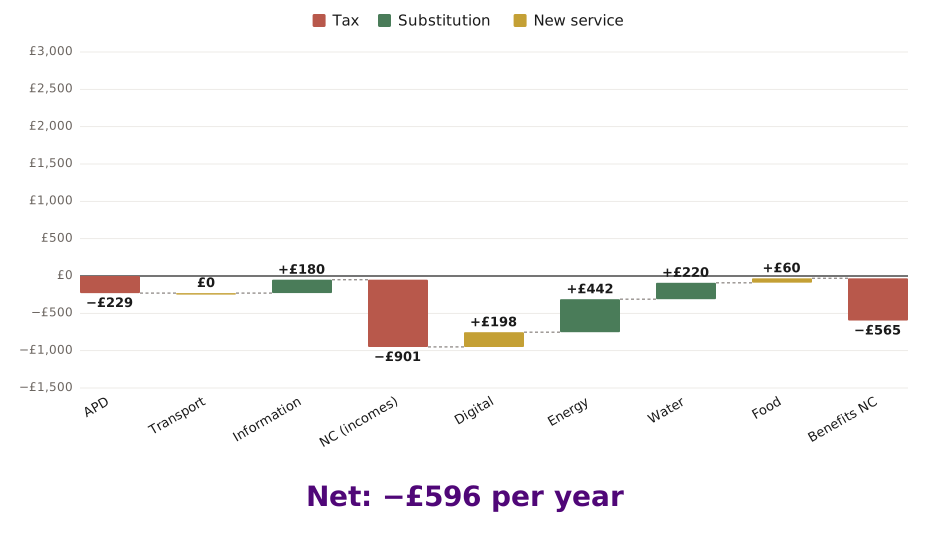
The clearest negative in the median row. The household pays a real earned-income contribution on pension income (−£901), a Benefits NC bite (−£565), and APD. The savings stack is dominated by Energy (£442), Water (£220), Digital (£198), and Information (£180). The crucial missing line is Transport, which is zero for pensioner households because they already receive free local bus travel.
WA No Children (Q3): +£794
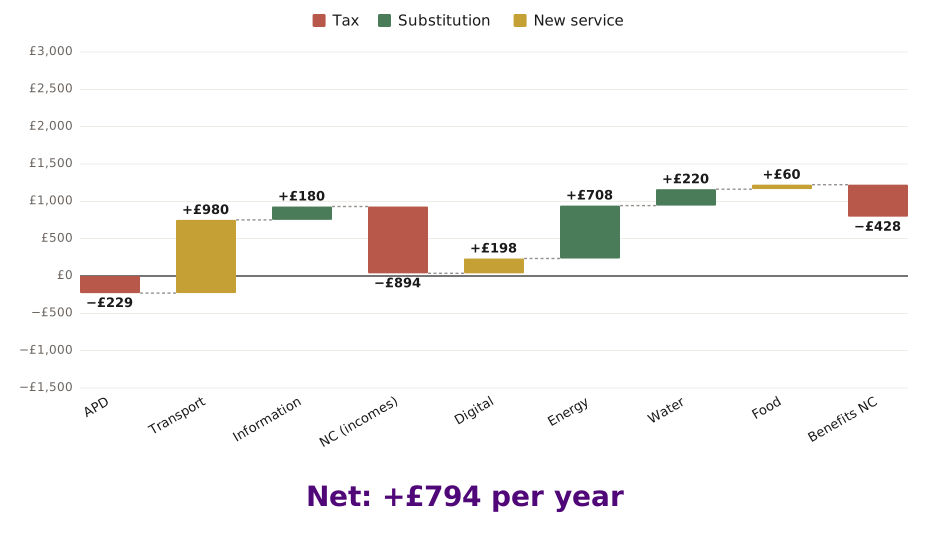
Net positive, driven by Transport (£980 on average across single WA and WA couples, with the single WA at this quintile capturing the premium commuting subsidy of £1,560). The earned-income NC is the single largest cost; the savings stack covers it.
Lone Parents (Q3): +£2,176
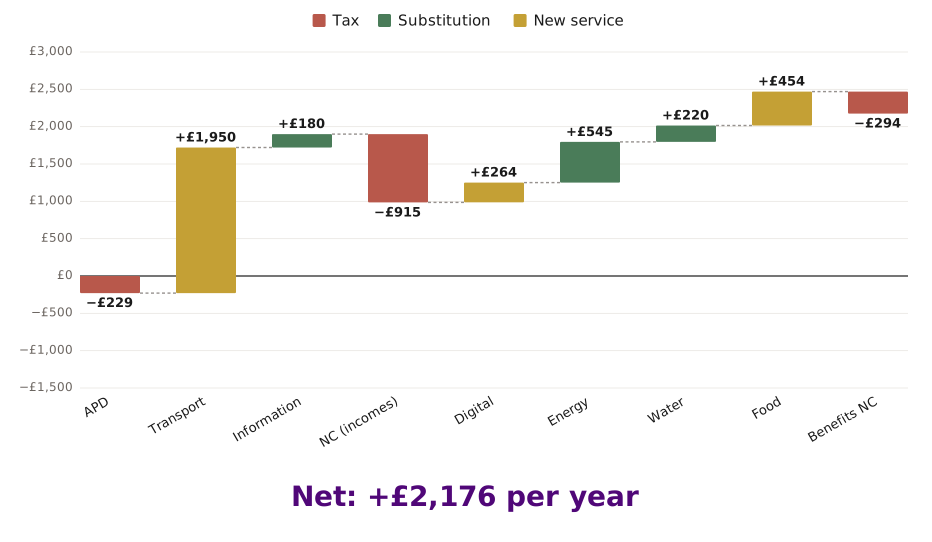
The largest net positive at Q3. Transport (£1,950, scaled by family size), Food (£454, community food centre access for school-age children), and Energy (£545) all contribute. The Benefits NC line stays small (−£294), much smaller than the equivalent line for pensioner or single working-age households at this quintile.
Couples + Children (Q3): +£1,735
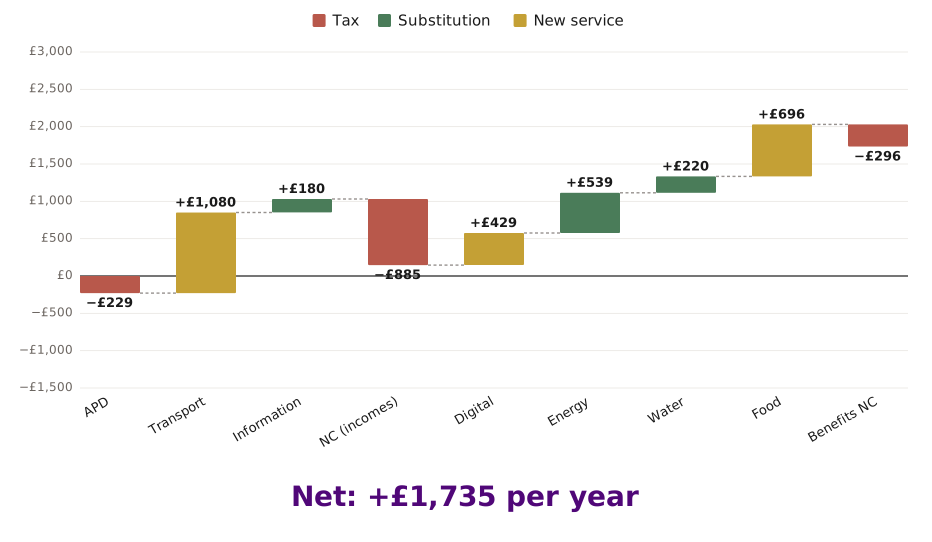
A meaningful positive, though smaller than at Q2. Transport at Q3 (£1,080) averages across one sub-type (Couple + 1 child) still showing a Transport saving of £3,120 and three larger sub-types dropping to £400. From Q4 onwards the household shifts predominantly to private transport. The savings stack (Food, Energy, Digital, Information, Water) is still substantial relative to the NC line.
Multi-adult (Q3): −£1,407
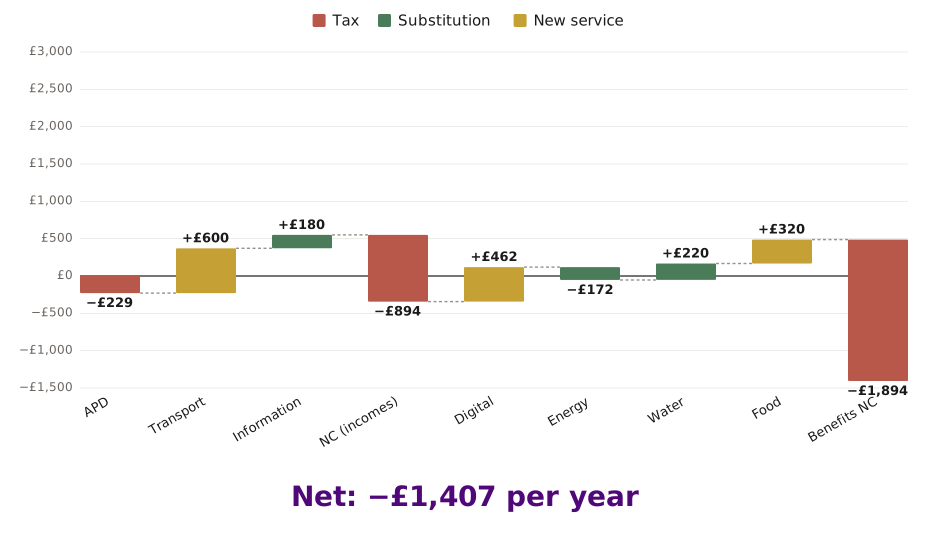
The other clearly negative Q3 result. The Benefits NC line at this cell (−£1,894) is the largest single Benefits NC bite anywhere in the matrix, with three working-age adults' benefits each taxed without children to mitigate. The household also pays earned-income NC on each adult, and the Energy line at this household type is now negative (−£172).
Q1 households (bottom quintile)
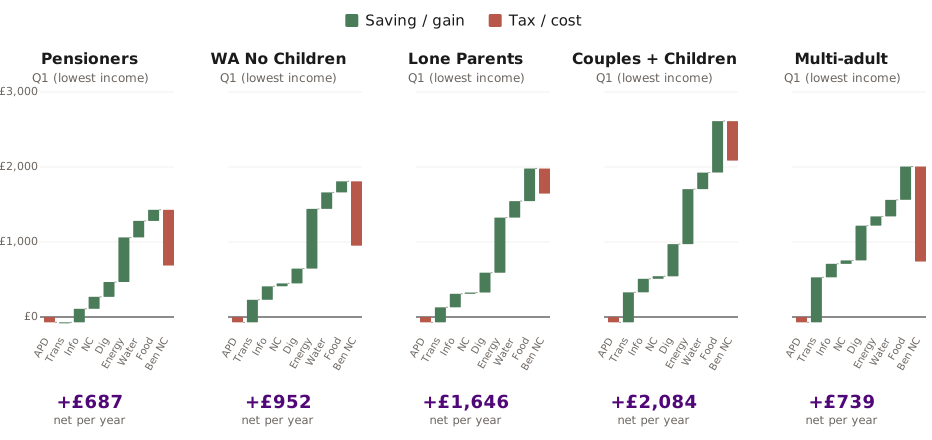
Every Q1 household type is net positive, ranging from +£687 (Pensioners) to +£2,084 (Couples + Children). The pattern is consistent: at Q1, the earned-income NC component is essentially zero or slightly positive (incomes below the contribution threshold), the Benefits NC bite is the dominant cost line, and the savings stack delivers most of its full value. The gradient through the five household types reflects household size, since Energy, Food and Digital savings all scale with size while the tax burden does not.
Pensioners gain least at Q1 because they receive no Transport saving. Couples + Children and Multi-adult gain most in absolute terms because their savings stack scales with both children and adults.
Q4 and Q5 households
By Q4, four of five household types are net negative. The exception is Couples + Children, which sits essentially at zero (+£38). By Q5, every household type is net negative, ranging from −£3,255 (Lone Parents) to −£5,940 (Multi-adult).
The full quintile-by-quintile detail for each household type, including line-item data tables, is in the companion Distributional Outcomes (Detail) appendix (see Related section below).
Source: IGP Social Prosperity Network. Steady-state programme assumptions, household-level model based on FRS microdata aggregated across thirteen disaggregated household sub-types.