
Full distributional view: every cell of the household-by-quintile model, with line-item waterfalls and underlying data tables. Companion to the Distributional Outcomes (Headlines) appendix, which carries the methodology, scope, and headline summary.
Each section covers one household type with a row of five waterfalls showing the gradient through the income quintiles from Q1 (lowest fifth) to Q5 (top fifth). Line items appear in a fixed order in every chart: APD, Transport, Information, NC (incomes), Digital, Energy, Water, Food, Benefits NC, Net. The y-axis range is set per household type so that quintiles within a section can be compared directly. Cross-household comparison is what the column chart in the Headlines appendix is for.
Charts use semantic two-colour shading: sage for any saving or gain, coral for any tax or cost. The Net total for each quintile appears as a large indigo figure below the chart. Numbers in the data tables are in £ per household per year at programme steady state.
Take Up
The effects depend substantially on modelling decisions about the take up of the Universal Services. In practice, behaviour will vary between households with the same profile and income depending on their decisions about how often to use the Services, how some of the Services are deployed locally, and over time as the Services scale up.
The results presented here can only be indicative as they are based on subjective assignments of behaviour to cohorts that will contain large variations in practice.
Pensioners
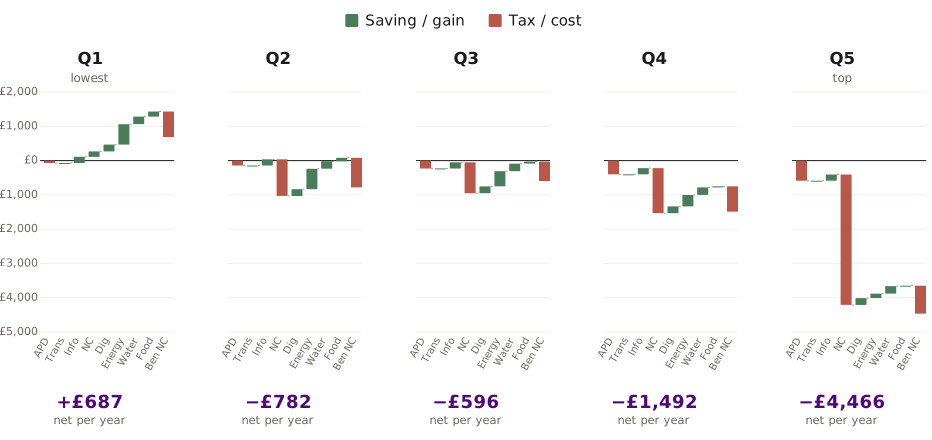
The pensioner gradient turns negative at Q2 and stays there. The structural reasons are three. First, Transport saving is zero in every quintile because pensioners already receive free local bus travel; the universal entitlement adds no new household value. Second, Energy saving scales out faster than for other household types: it falls from £594 at Q1 to £129 at Q5 (where Partnered Pensioners reach a small Energy cost). Third, NC on incomes applies to pension income exactly as to wages, growing continuously through the quintiles from a small positive at Q1 (+£160) to a substantial cost at Q5 (−£3,803). The gains that hold across all quintiles are Information (£180), Digital (£198), and Water (£220); Energy is larger at Q1 to Q3 but tapers.
| Line item (£/yr) | Q1 | Q2 | Q3 | Q4 | Q5 |
|---|---|---|---|---|---|
| APD | −£71 | −£143 | −£229 | −£400 | −£586 |
| Transport | £0 | £0 | £0 | £0 | £0 |
| Information | £180 | £180 | £180 | £180 | £180 |
| NC (incomes) | £160 | −£1,069 | −£901 | −£1,314 | −£3,803 |
| Digital | £198 | £198 | £198 | £198 | £198 |
| Energy | £594 | £594 | £442 | £333 | £129 |
| Water | £220 | £220 | £220 | £220 | £220 |
| Food | £148 | £102 | £60 | £33 | £14 |
| Benefits NC | −£743 | −£864 | −£565 | −£742 | −£818 |
| Net total | £687 | −£782 | −£596 | −£1,492 | −£4,466 |
WA No Children
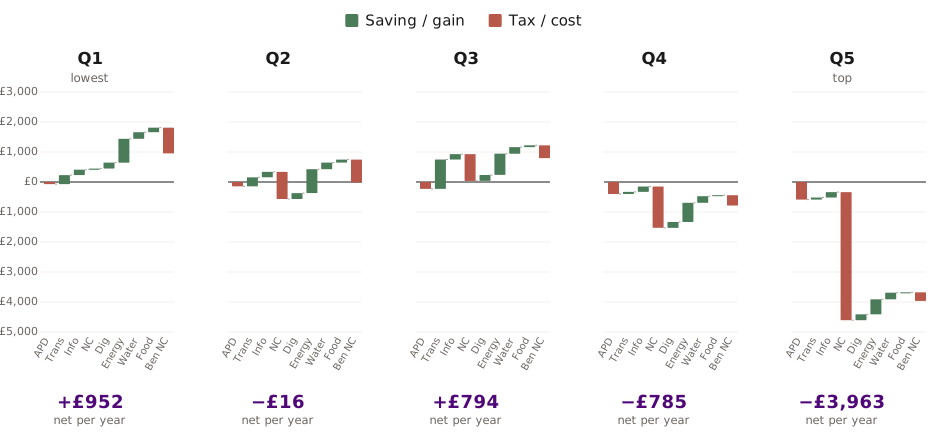
Working-age households without children show a non-monotonic gradient: Q3 is more positive than Q2. The Q2 Transport saving averages £300; Q3 single WA workers (likely to be in full time employment) access the full Transport savings of £1,560, lifting the aggregate Transport line at Q3 to £980. From Q4 onwards, the earned-income NC dominates, taking the household clearly negative.
| Line item (£/yr) | Q1 | Q2 | Q3 | Q4 | Q5 |
|---|---|---|---|---|---|
| APD | −£71 | −£143 | −£229 | −£400 | −£586 |
| Transport | £300 | £300 | £980 | £68 | £68 |
| Information | £180 | £180 | £180 | £180 | £180 |
| NC (incomes) | £38 | −£905 | −£894 | −£1,378 | −£4,269 |
| Digital | £198 | £198 | £198 | £198 | £198 |
| Energy | £796 | £796 | £708 | £639 | £499 |
| Water | £220 | £220 | £220 | £220 | £220 |
| Food | £148 | £102 | £60 | £33 | £14 |
| Benefits NC | −£858 | −£764 | −£428 | −£345 | −£287 |
| Net total | £952 | −£16 | £794 | −£785 | −£3,963 |
Lone Parents
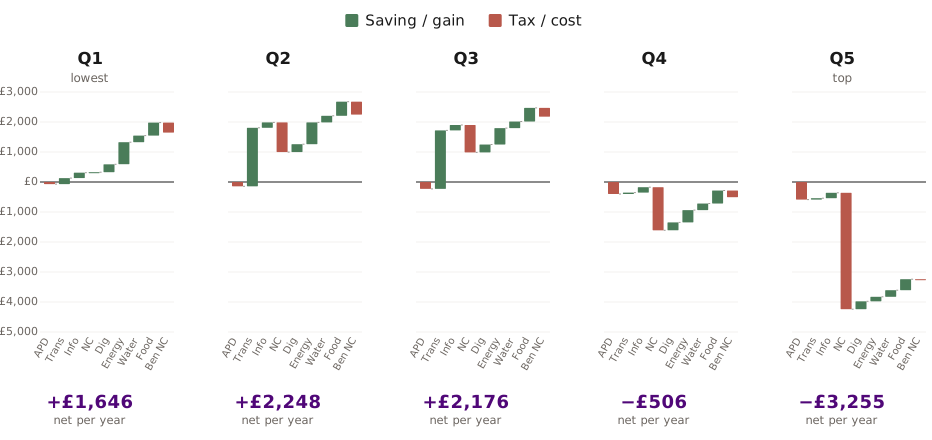
Lone parents are the household type that benefits most consistently across quintiles. Net effect is positive through Q3 and only modestly negative at Q4 (−£506). The pattern reflects two features of the underlying data. The Benefits NC bite stays small throughout (from −£334 at Q1 to −£14 at Q5), much smaller than the equivalent line for pensioner or single working-age households at the same quintile. And Food saving scales with the number of school-age children, holding up across quintiles from £434 at Q1 to £366 at Q5. The Q5 Lone Parents loss (−£3,255) is the smallest absolute Q5 loss across all five household types.
| Line item (£/yr) | Q1 | Q2 | Q3 | Q4 | Q5 |
|---|---|---|---|---|---|
| APD | −£71 | −£143 | −£229 | −£400 | −£586 |
| Transport | £200 | £1,950 | £1,950 | £46 | £46 |
| Information | £180 | £180 | £180 | £180 | £180 |
| NC (incomes) | £18 | −£990 | −£915 | −£1,436 | −£3,882 |
| Digital | £264 | £264 | £264 | £264 | £264 |
| Energy | £735 | £727 | £545 | £409 | £151 |
| Water | £220 | £220 | £220 | £220 | £220 |
| Food | £434 | £470 | £454 | £433 | £366 |
| Benefits NC | −£334 | −£430 | −£294 | −£222 | −£14 |
| Net total | £1,646 | £2,248 | £2,176 | −£506 | −£3,255 |
Couples + Children
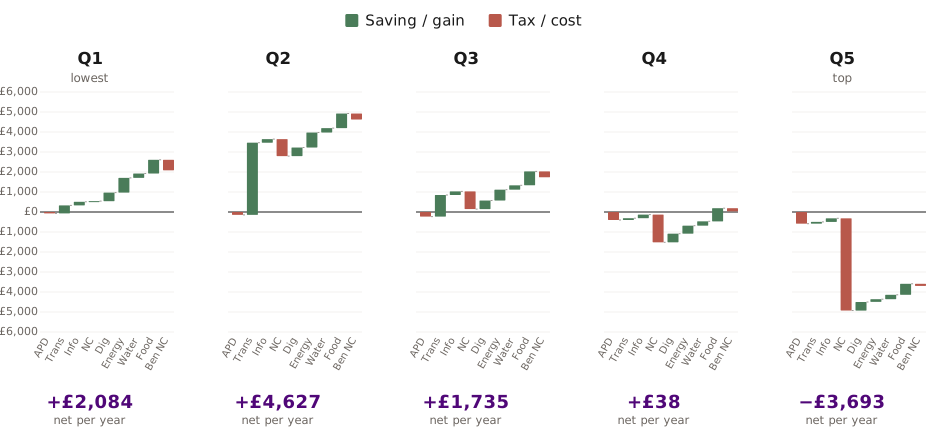
Couples with children show the largest single net gain anywhere in the matrix: +£4,627 at Q2. The driver is Transport. At Q2 a two-adult-commuter household shows an aggregate Transport saving of £3,608, the biggest of any cell. Energy savings also peak slightly at Q2 (£751 versus £733 at Q1). From Q3 onwards, Transport falls sharply as larger households shift to private transport, while the earned-income NC grows. By Q4 the household is roughly at break-even (£38); by Q5 it is clearly negative (−£3,693).
| Line item (£/yr) | Q1 | Q2 | Q3 | Q4 | Q5 |
|---|---|---|---|---|---|
| APD | −£71 | −£143 | −£229 | −£400 | −£586 |
| Transport | £400 | £3,608 | £1,080 | £91 | £91 |
| Information | £180 | £180 | £180 | £180 | £180 |
| NC (incomes) | £34 | −£850 | −£885 | −£1,386 | −£4,612 |
| Digital | £429 | £429 | £429 | £429 | £429 |
| Energy | £733 | £751 | £539 | £400 | £136 |
| Water | £220 | £220 | £220 | £220 | £220 |
| Food | £686 | £730 | £696 | £658 | £552 |
| Benefits NC | −£527 | −£298 | −£296 | −£153 | −£103 |
| Net total | £2,084 | £4,627 | £1,735 | £38 | −£3,693 |
Multi-adult
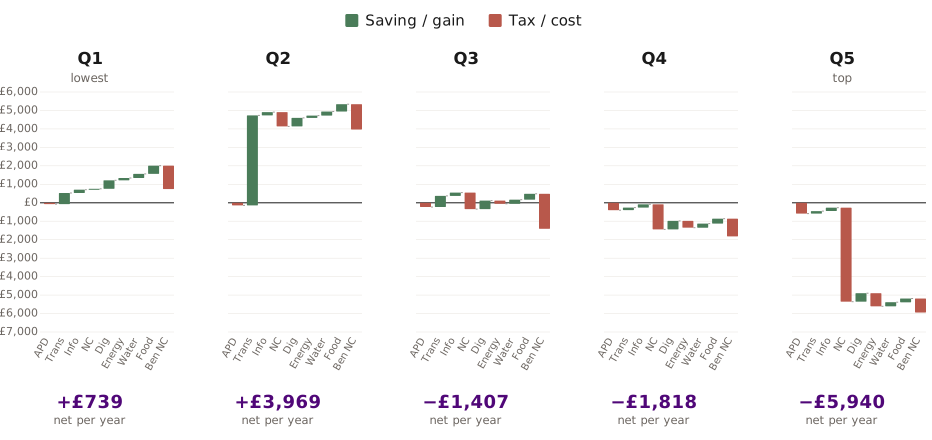
Multi-adult households have the steepest gradient in the matrix. Q2 is strongly positive (+£3,969), driven by a large aggregate Transport saving (£4,875, three commuting adults averaged across the two sub-types). By Q3 the household is already clearly negative (−£1,407), and the loss deepens through Q4 and Q5. Two structural features drive this. The household-level savings (Water is universal at £220; Energy is largely per household; Food and Digital scale by household structure rather than by adult count) do not grow proportionally with the number of adults. The earned-income NC, by contrast, scales with each adult's income. And the Benefits NC line at Q3 (−£1,894) is the largest single Benefits NC bite in the entire matrix, with three working-age adults' benefits each taxed without children to mitigate. By Q5 the household contributes −£5,940, the deepest single loss across any household type.
| Line item (£/yr) | Q1 | Q2 | Q3 | Q4 | Q5 |
|---|---|---|---|---|---|
| APD | −£71 | −£143 | −£229 | −£400 | −£586 |
| Transport | £600 | £4,875 | £600 | £137 | £137 |
| Information | £180 | £180 | £180 | £180 | £180 |
| NC (incomes) | £46 | −£775 | −£894 | −£1,362 | −£5,090 |
| Digital | £462 | £462 | £462 | £462 | £462 |
| Energy | £124 | £124 | −£172 | −£366 | −£710 |
| Water | £220 | £220 | £220 | £220 | £220 |
| Food | £444 | £394 | £320 | £268 | £205 |
| Benefits NC | −£1,267 | −£1,368 | −£1,894 | −£957 | −£757 |
| Net total | £739 | £3,969 | −£1,407 | −£1,818 | −£5,940 |
Source: IGP Social Prosperity Network. Refer to Distributional Outcomes (Headlines) for methodology, scope, and phase-in notes.