
The P2030 household data model covers the six core universal services (transport, energy, water, information and digital, food, and school meals) and produces a gross service value of £59.0 billion before deductions. Deducting the APD increase (£8 billion, a cost to households concentrated at higher incomes) and the NC on benefits (£16.0 billion, offset by the services received) gives the net household value of £27 billion.
The distributional impacts are measured across two primary axes: total income Quintiles, and Household types.
Income Quintiles
The base data set (from FRS, see appendix) is resorted to reflect total income as defined for National Contributions, which includes all incomes from earned and unearned sources. This means that the quintiles do not map onto traditional boundaries, which typically use only earned incomes.
Each quintile contains about 10 million adults with average total incomes per this table.
| Quintile | Average Total Income (£/year) |
|---|---|
| Q1 (P1–P20) | 1,673 |
| Q2 (P21–P40) | 15,638 |
| Q3 (P41–P60) | 27,019 |
| Q4 (P61–P80) | 39,447 |
| Q5 (P81–P100) | 96,902 |
[Total NC Income Quintiles]
Household types
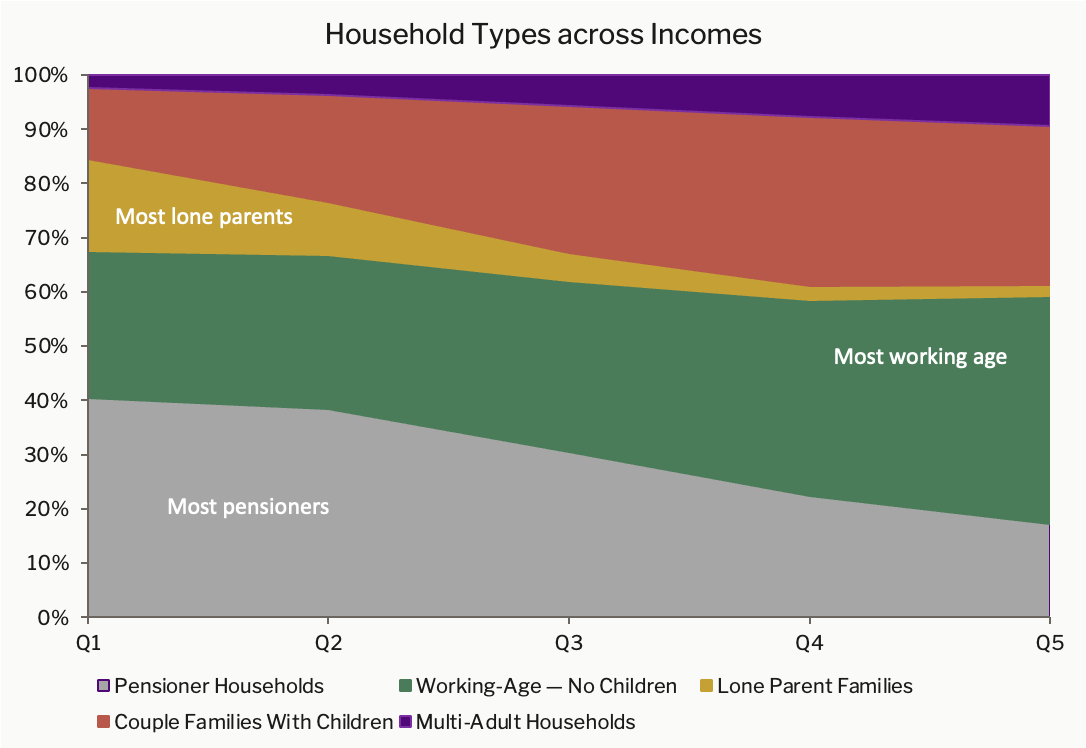
It is important to keep in mind that different quintiles of the income range contain different types of households. Pensioners more concentrated in Q1. Multi-adult households are a small portion overall, nearly half are in Q5.
The UK’s break-down by household type is also instructive for understanding where policy lands and who is affected. Pensioners and then working-age adults without dependent children are the largest groups.
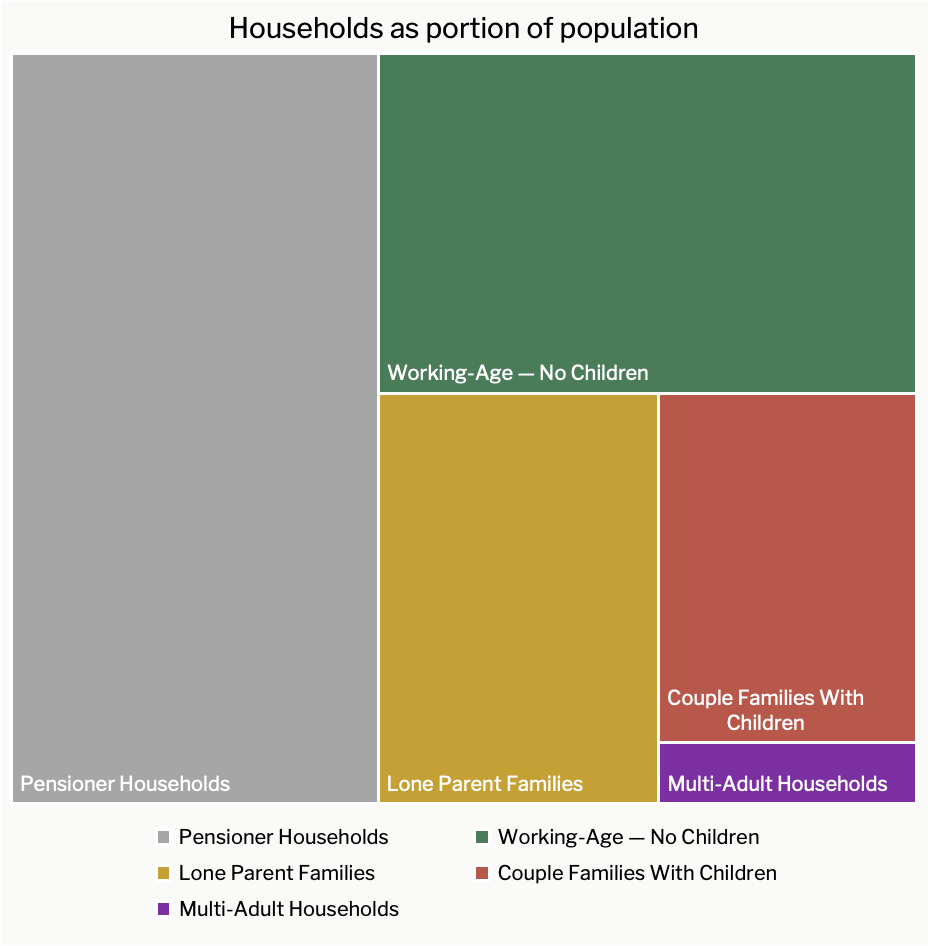
At the most granular level, the model uses these household types:
- PENSIONER HOUSEHOLDS
- Single Pensioner
- Partnered Pensioners
- WORKING-AGE — NO CHILDREN
- Single (WA)
- WA Couple (no children)
- LONE PARENT FAMILIES
- Lone Parent + 1 child (0-1)
- Lone Parent + 2 children (2-4, pri)
- Lone Parent + 3 children (2-4, pri, sec)
- COUPLE FAMILIES WITH CHILDREN
- Couple + 1 child (0-1)
- Couple + 2 children (2-4, pri)
- Couple + 3 children (2-4, pri, sec)
- Couple + 4 children (0-1, 2-4, pri, sec)
- MULTI-ADULT HOUSEHOLDS
- Multi-adult (3+ adults)
- Multi-adult + 1 child
For the presentation of distributional analysis overlaid with per quintile total incomes, the household types are distilled to the first tier of types to keep the content more easily digestible. When calculating aggregate savings, the values are weighted by national household composition.
Service Take Up
Universal Services are, by definition, unconditionally accessible and free at the point of use. In some cases, such as the Universal Digital Service, the model assumes universal take up. Others, such as free school meals, are prescribed in their take-up by the audience they serve, in this case only school age children. And other services are behaviourally dependent, meaning that people make a choice whether to take up the service or not. For instance, some will use buses for all their transport, some will reduce their energy use to eliminate their energy bill. But others won’t because they don’t want to, or consider the extra cost of the alternative to be worth it for themselves.
A matrix of Service uptake is applied across both primary axes, household type by quintile, for each Service. This table provides a guide across income quintiles for the take-up rates used in the modelling (% of maximum use).
| Service | Q1 | Q2 | Q3 | Q4 | Q5 |
| Energy: standing charge abolition | Universal | Universal | Universal | Universal | Universal |
| Energy: lower bills | 83% | 83% | 77% | 73% | 67% |
| Water: bills abolished | Universal | Universal | Universal | Universal | Universal |
| TV licence: abolished | Universal | Universal | Universal | Universal | Universal |
| Universal Transport | 15% § | 72% | 47% | 4% | 4% |
| Universal Digital | Universal | Universal | Universal | Universal | Universal |
| Universal Food - School Meals - Term time | Students | Students | Students | Students | Students |
| Universal Food - School Meals - Year round | 40% | 35% | 20% | 10% | 0% |
| Universal Food - CFC | 35% | 24% | 17% | 10% | 5% |
| Universal Food - Participating Venues | 12% | 10% | 8% | 6% | 4% |
[Take up rates across incomes]
§ Q1 has many pensioners, who already get free bus use
Timing
A fourth dimension is the schedule of tax reforms and Service availability, which affect the distributional impacts over the period of the programme. Given the limitations of presentation in two dimensions, the report models the effects at steady state (the final year of the P2030 programme) unless otherwise specified.