
Figures are quoted at reconciliation precision; see Uncertainty and Precision in the FAQ for how they should be read.
Prosperity 2030 creates £3 of value to households and £2 of fiscal space for every £2 of net contribution.
This is not fiscal alchemy. It is the result of interlocking policies to drive down the cost of living with Universal Services, reform taxation, and build social infrastructure. The political permission for tax rises does not exist without the services. The revenue for social infrastructure does not exist without the taxes. And the fiscal space can only be created through the combination of services and taxes.
Services Make Space
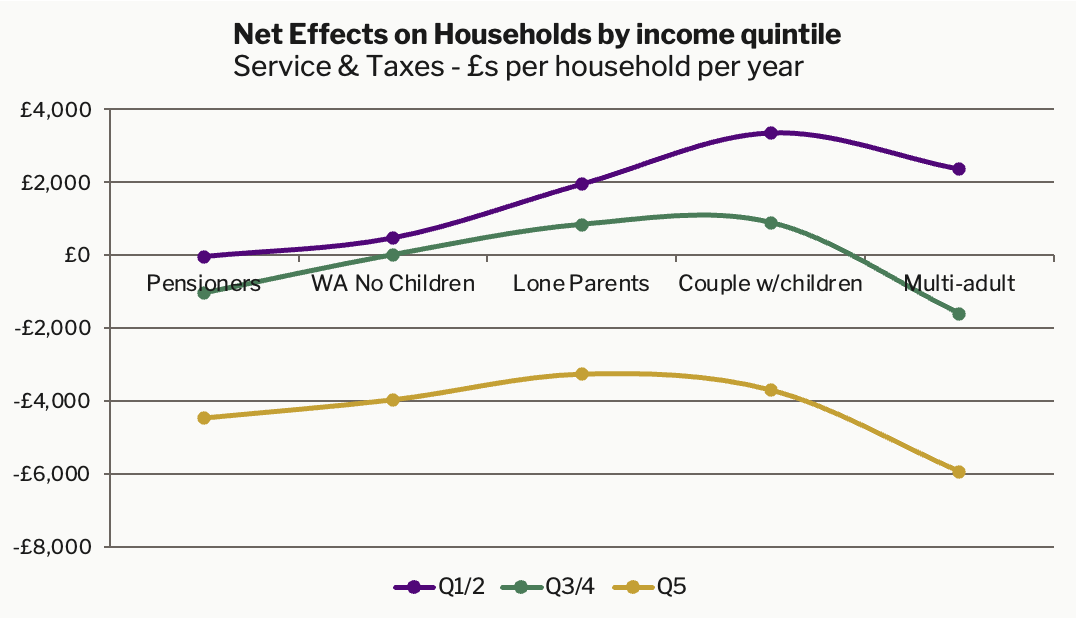
The P2030 programme shows that strategic policy sequencing can create 1.4% GDP of fiscal space and reduce the cost of living by an average of £800 a year for households in the lower three quartiles. The cost of living is reduced by £4,600 a year for families with high service uptake. The fiscal space is created because the tax revenues are spent on services that displace more costs for households than they cost to deliver. That efficiency creates confidence and permission in the social contract to assign further resources to currently unfunded national priorities.
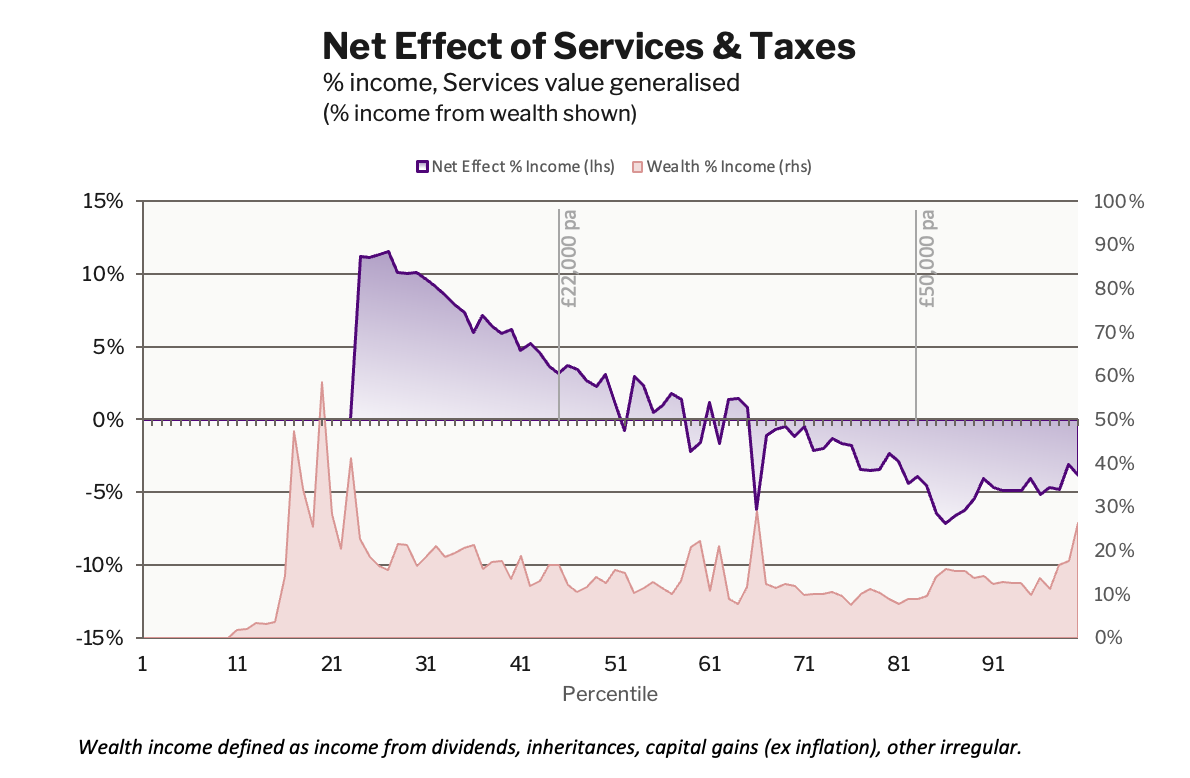
NC incomes tax reform broadens the revenue base and increases revenues by 2.8% of GDP, which is completely offset by falls in the cost of living for 44% of households.
Headroom within Programme
Over four years, there is £100 billion of fiscal slack to accommodate adaptations to the implementation of new taxes and new services. At no point is the margin between revenues and expenditures so narrow that additional borrowing would be needed.
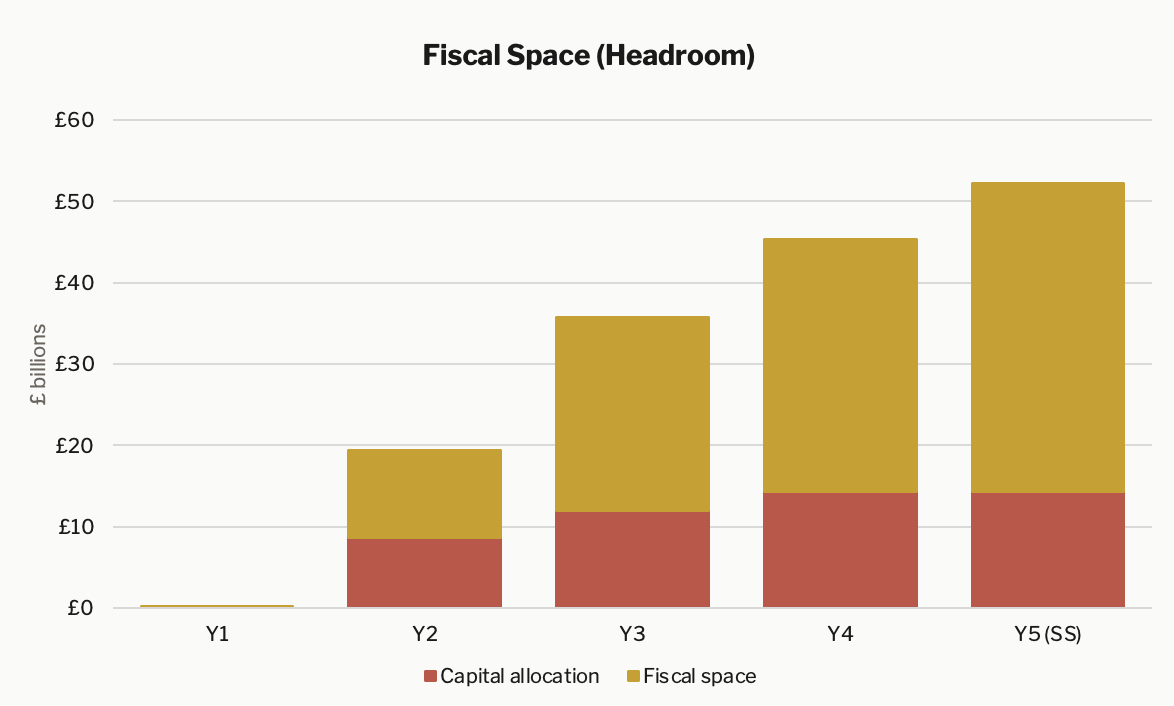
The chart shows capital allocation, to indicate an additional buffer available for short-term cashflow in the event it was needed.
Highlights
Highlights of the programme outcomes, that are blocked in the current policy environment, include:
- National priorities funded with 1.4% GDP additional fiscal space (enough to cover NATO 2035 obligations)
- Local priorities for housing and social care funded with 0.7% GDP
- Social resilience strengthened with the broadest expansion of universal provision since the Attlee settlement in 1945, including new community facilities and service hubs in every outward postcode in the country
- Incomes tax reform that increases work incentives, removes distortions, and creates a stable, broader revenue base for the future
- Property tax reform to increase local capacity, stabilise local government finances, and remove regressive tax distortions
- Essential restructuring to enable transitions in the energy, water, and digital utility sectors to meet new economy and environmental challenges