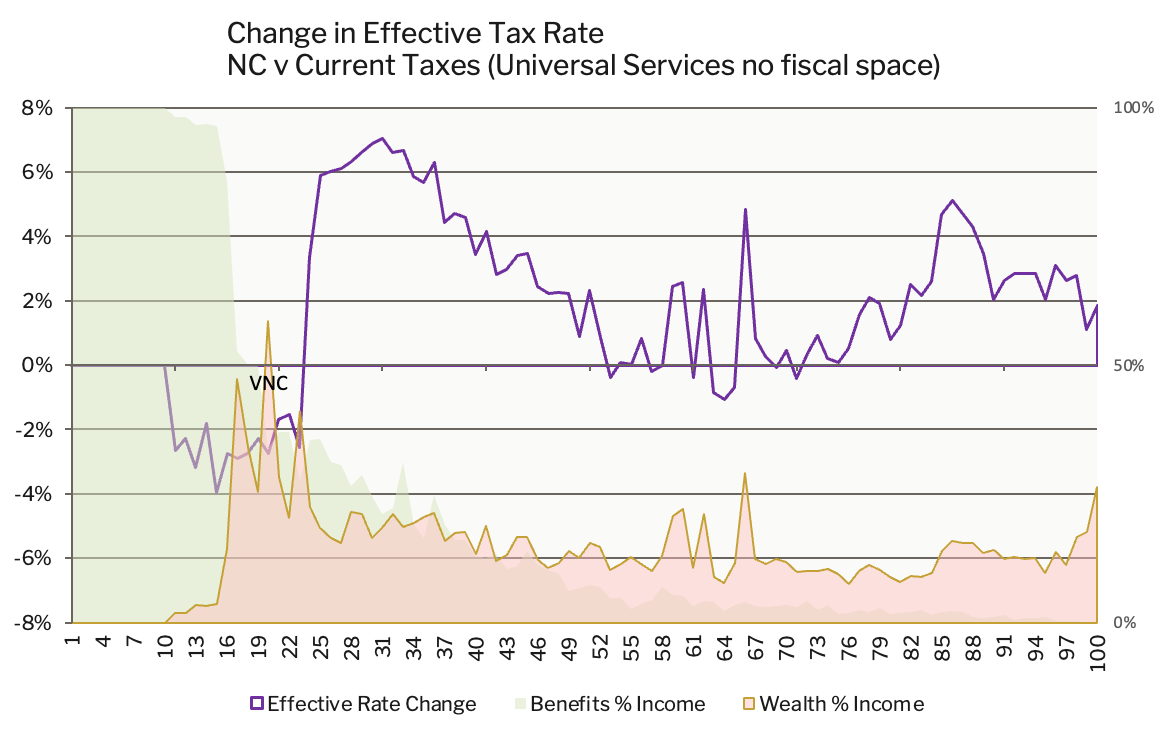
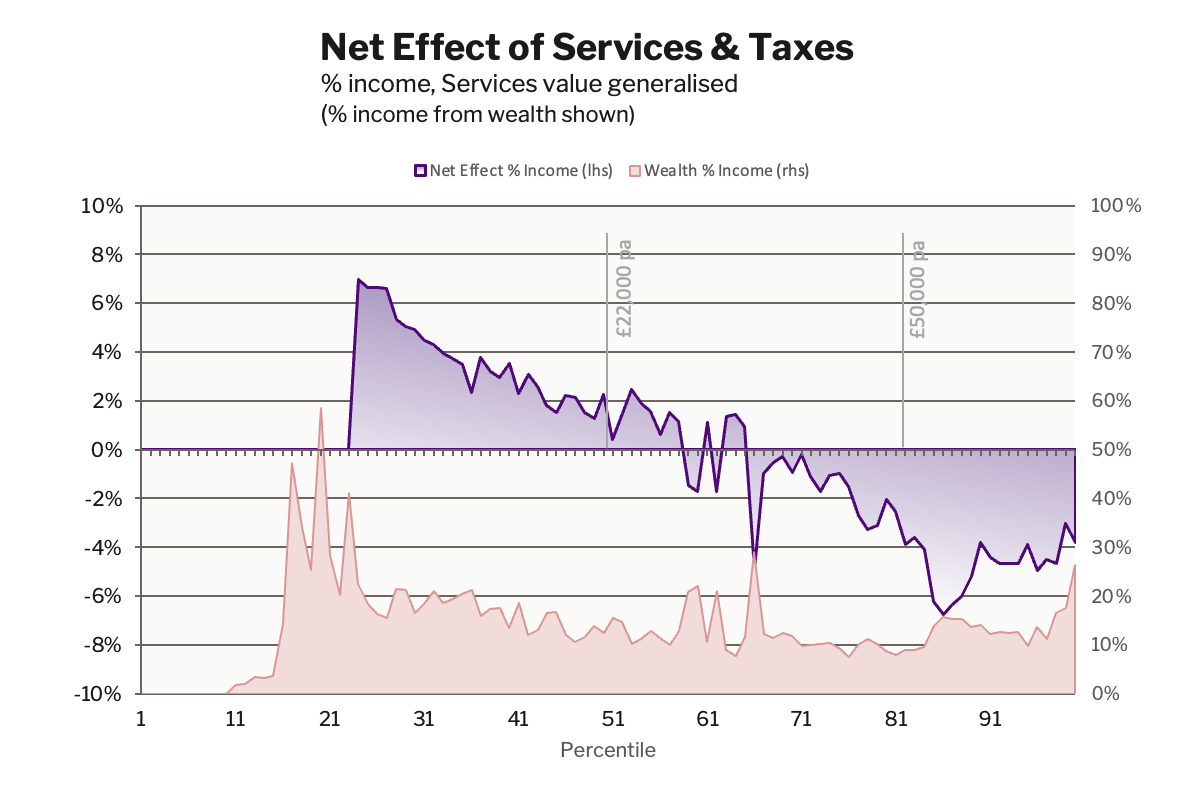
The effects of National Contributions (NC), as part of the P2030 programme, are best understood in the round, alongside the cost of living reductions that it enables. At least 44% of households have higher disposable incomes overall as a result of the P2030 policy programme once the value of the Services and the Taxes are taken into account.
This includes generating the extra fiscal space. (Analysis of a scenario that only funds the Services, and does not generate extra revenues, is lower down this article – see Universal Services scenario.)
NC Taxes Wages Less
In the P2030 model that generates the additional fiscal space, NC taxes for those with earned income only are lower than under the current system for 72% of full-time workers (55% of all earners). This is because NC raises revenue from unearned incomes equally to earned incomes, so relies less on taxing wages.
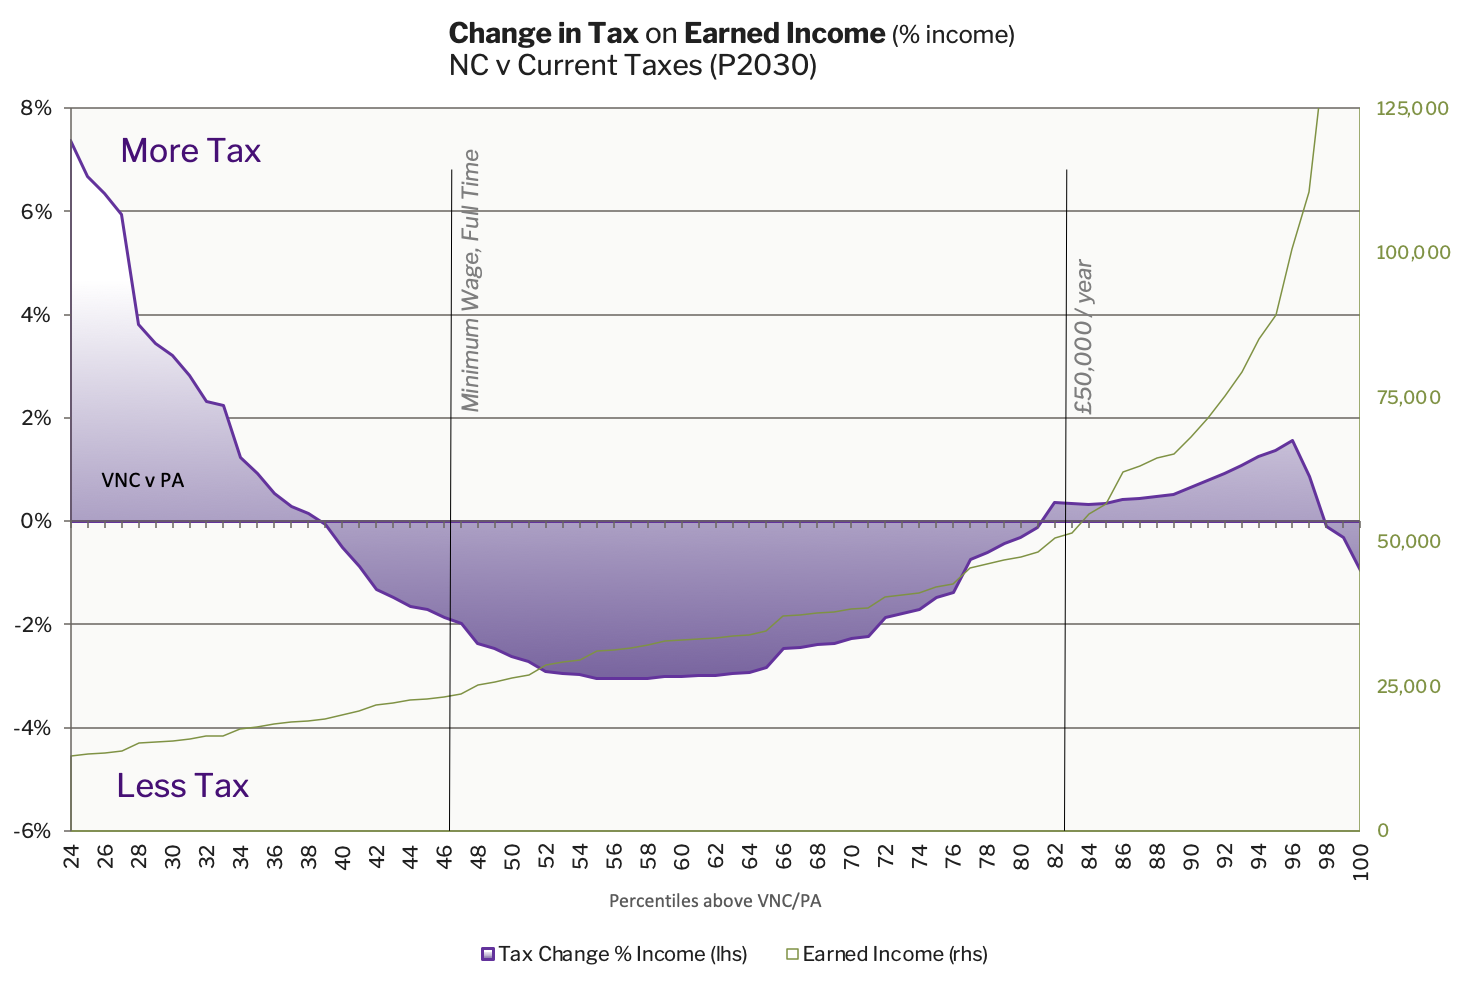
NC are lower than current taxes for everyone in full-time employment earning between minimum wage and double that, with no other income.
For those who have high unearned incomes from other sources the effect is the opposite. Including all sources of income will increase the effective tax rate across all income, including wages.
VNC v PA
There are some incomes just above the current Personal Allowance (£12,570 a year) who would see higher taxes compared to the current system because when income exceeds the VNC threshold in NC, then tax on all income is due.
Four Income Groups
Overall, including all forms of income, 13% have lower taxes, 77% higher taxes, and 10% unchanged compared to current taxes.
Taxes are higher across the board because the P2030 programme generates more revenue. This effect is a result of the decision to create spare fiscal space, not of the design of NC.
Earnings in the bottom income quintile are protected under NC because remittance is voluntary for total incomes below £12,570. Half of this group only have benefit income, and the other half get up to 50% of their income from wealth. The NC allowance shelters more unearned income for this lowest income group than the various allowances in the current system.
The second group, with annual income between £13,000 and £25,000, get between half and a quarter of their income from benefits and wealth. For this group, NC taxes average 6% more than current taxes, increasing by an average of £1,000 a year.
The third group, represents everyone working full-time and earning minimum wage to double the minimum wage, comprising the majority of people working in services from nursing to retail with annual incomes from £25,000 to £50,000. For this group, taxes increase by 2.8% (£1,000) on average.
Those earning more than £50,000 pay about 5% more than they do in the current system. Taxes rise by an average of £3,800 a year for those with incomes between £50,000 and £90,000. Those in the top 1% of total incomes pay 4% more tax than under the current system.
The larger the share of someone's income that comes from sources taxed lightly today, the larger their increase under NC, because the rate set by total income applies across all sources.
The NC revenues from benefits are reallocated to public services, so are returned in kind and most likely to benefit people with low incomes.
Hypothetical : Universal Services only
Comparing two scenarios reveals the effect of the decision to create additional fiscal space for other national priorities. Here we compare a programme that only adopts Universal Services, with no fiscal space, to the P2030 programme.
A US only programme could be funded with NC Base and Top rates set to 19% and 44%, instead of the P2030 scenario rates of 22% and 46%. This would still fund the Universal Services but would not yield any additional revenues for other national priorities.
Analysis of US only scenario v P2030
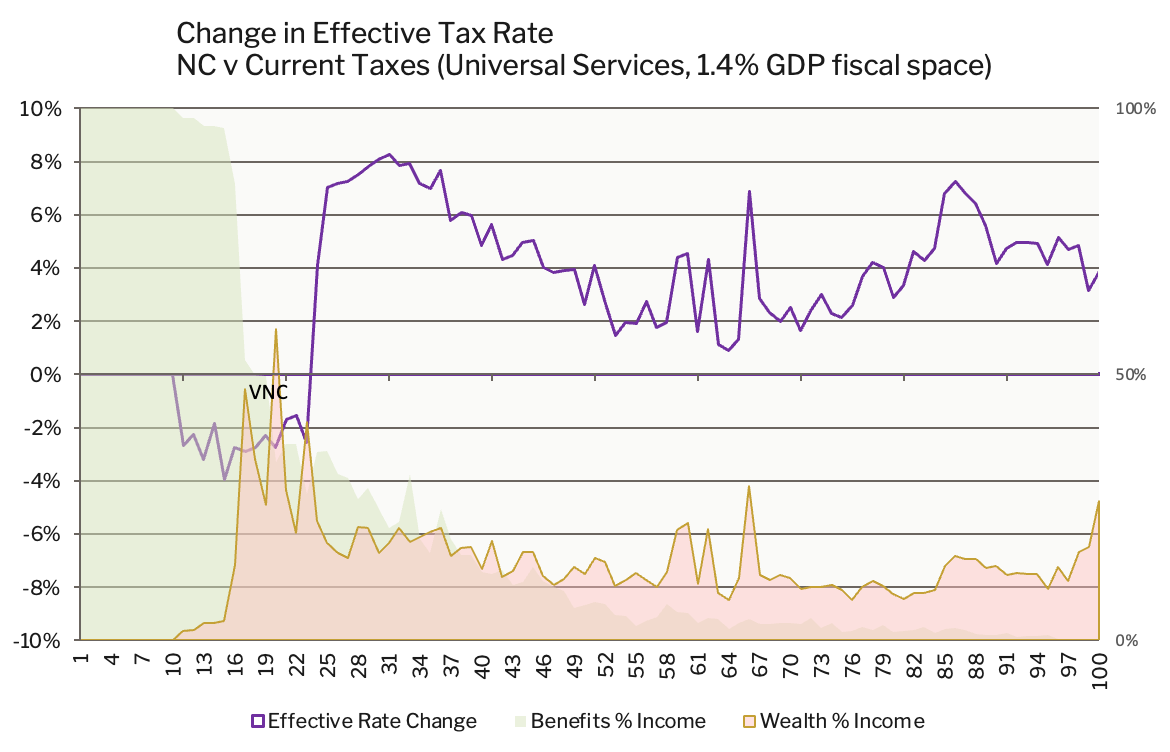
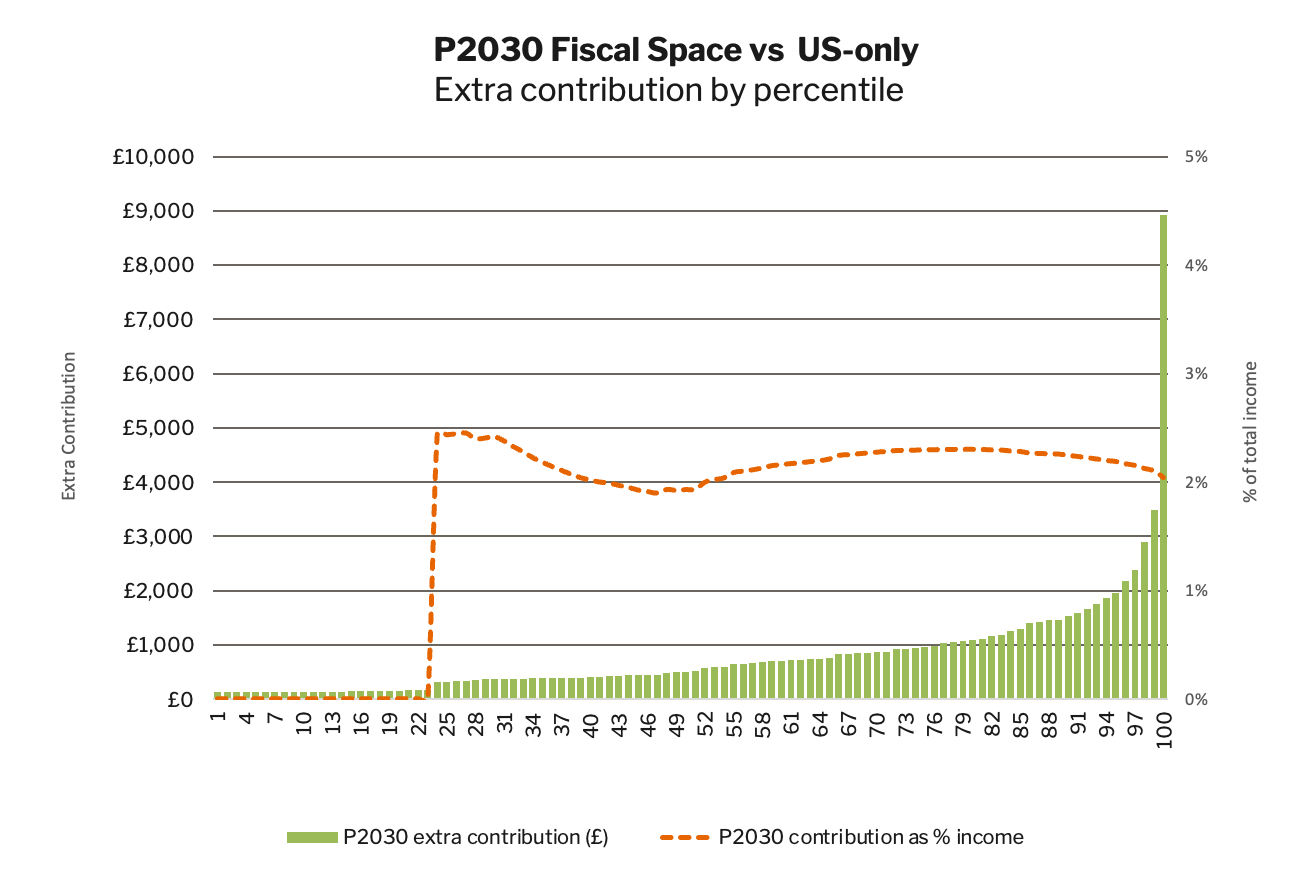
The additional contributions, compared to current taxes, made in the US only scenario are uniformly 2% less than in the P2030 scenario. This is an expected outcome where the revenues generated are smaller by 1.4% of GDP.
The extra contributions are made by everyone, as the rates of NC apply to all incomes, including taxable benefits. At the bottom of the income distribution the extra contribution is £130, and at the top it is £9,000 a year.
The uniform distribution of the additional contributions is a feature of NC’s progressive rate design, so the burden of national priorities falls evenly across the population.
After accounting for the offsetting value of Universal Services (generalised and applied at income percentiles), the net effects of the US only programme are positive across about 60% of households, compared to 44% in the P2030 programme.
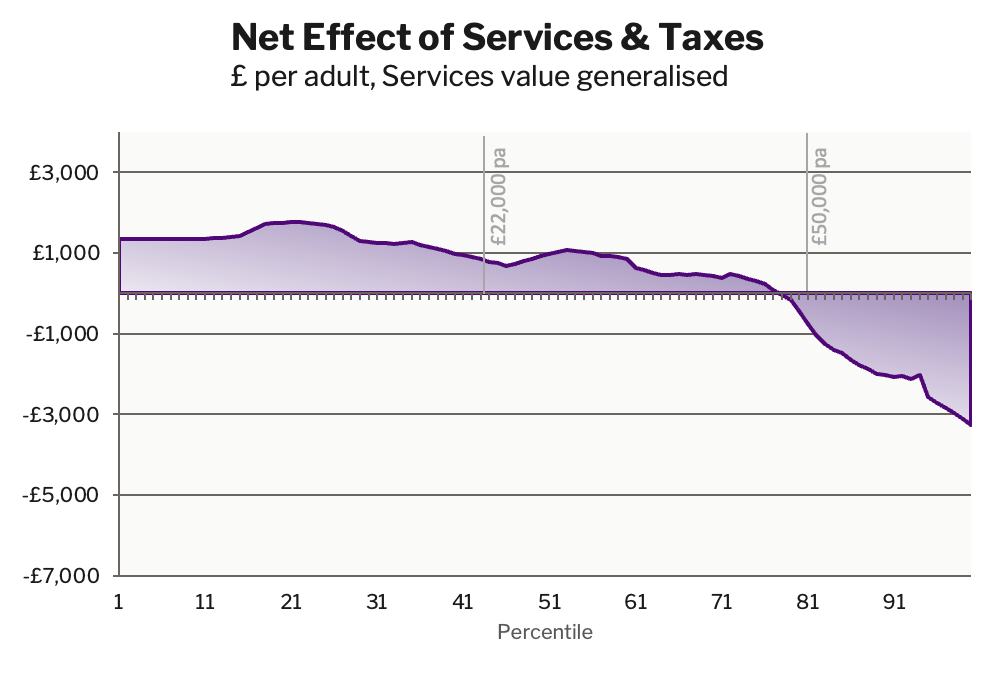
Results of US only model v Current taxes
Everyone still has higher taxes compared to current taxes, but the increases are smaller, as expected. The middle incomes (£28,000 - £40,000) have only minimal increases.