Summary
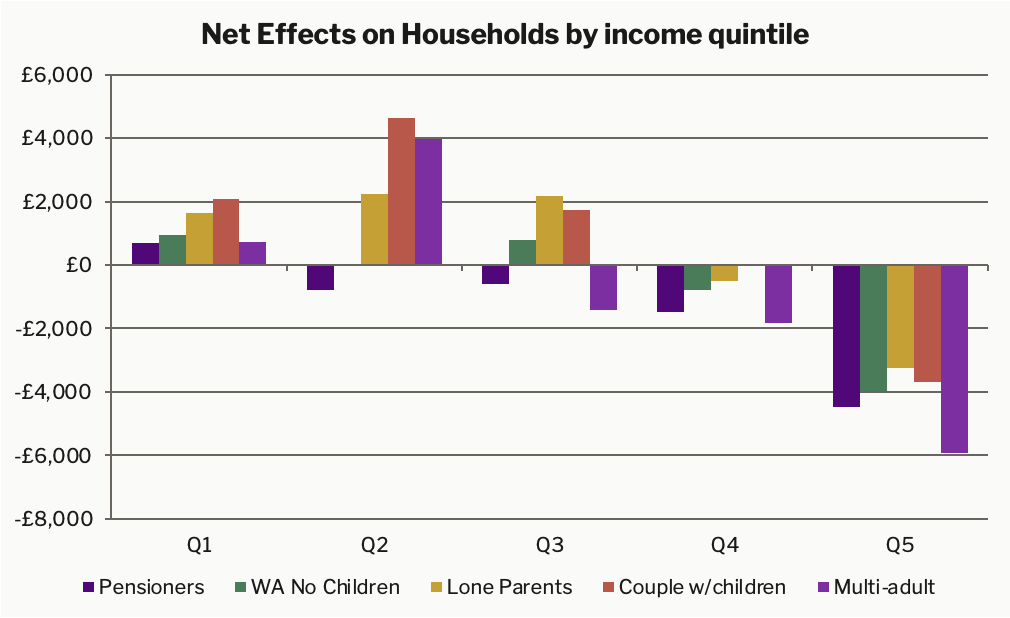
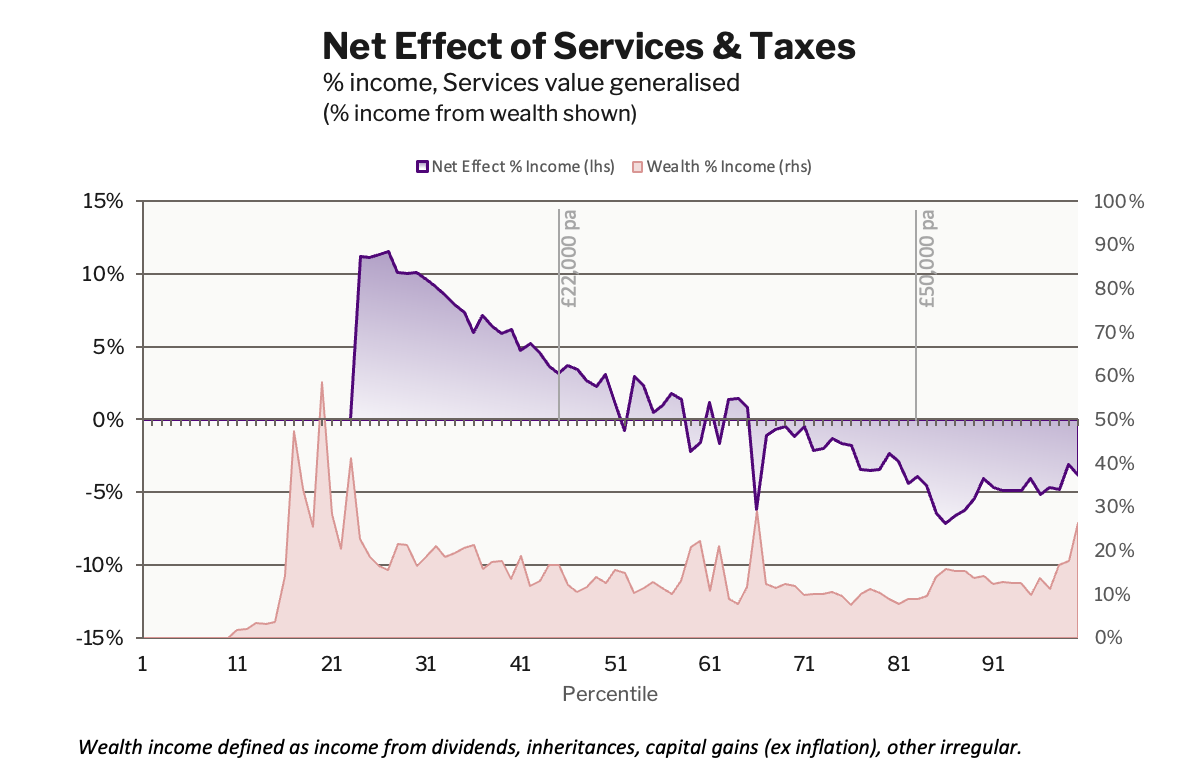
The P2030 programme increases taxes and uses them to pay for new public services that are more efficient at reducing the cost of living than equivalent cash benefits. Some cash distribution is recycled into service provision. The combination of the service efficiency and the cash reallocation allows the programme to offset the additional tax burden for 44% of households, while generating excess revenues of 1.4% of GDP.
The scale and inherent uncertainties in modelling national accounts 5 years out means that the key numbers are presented in percentages of GDP. Components may not sum to totals due to independent rounding.
At steady state, the Prosperity 2030 programme changes the UK's public finances as follows:
- Additional revenues from the private economy: 3.7% GDP (£100 billion)
- Restructured benefit expenditure: 0.6% GDP (£16 billion)
- New public service and infrastructure operating costs: 2.4% GDP (£65 billion)
- Capital allocation (transport and housing construction): 0.5% GDP (£14 billion)
- Discretionary fiscal space for national priorities: 1.4% GDP (£38 billion)
The programme creates 4.3% GDP of total public value from a net household burden of 2.1% GDP
The 4.3% GDP of public value comes from:
- 2.4% GDP in new services
- 0.5% GDP in capital investment (not borrowed)
- 1.4% new fiscal space at steady state
The “net household burden” starts with 4.3% GDP in taxes, which is offset by 2.2% GDP in service value, leaving a net household burden of 2.1% GDP.
Tax take
The public sector share of GDP (tax take) increases by 3.7% GDP:
- 2.8% GDP from reformed incomes taxes
- 0.7% GDP from property tax reforms
- 0.2% GDP from other duties and tax reforms
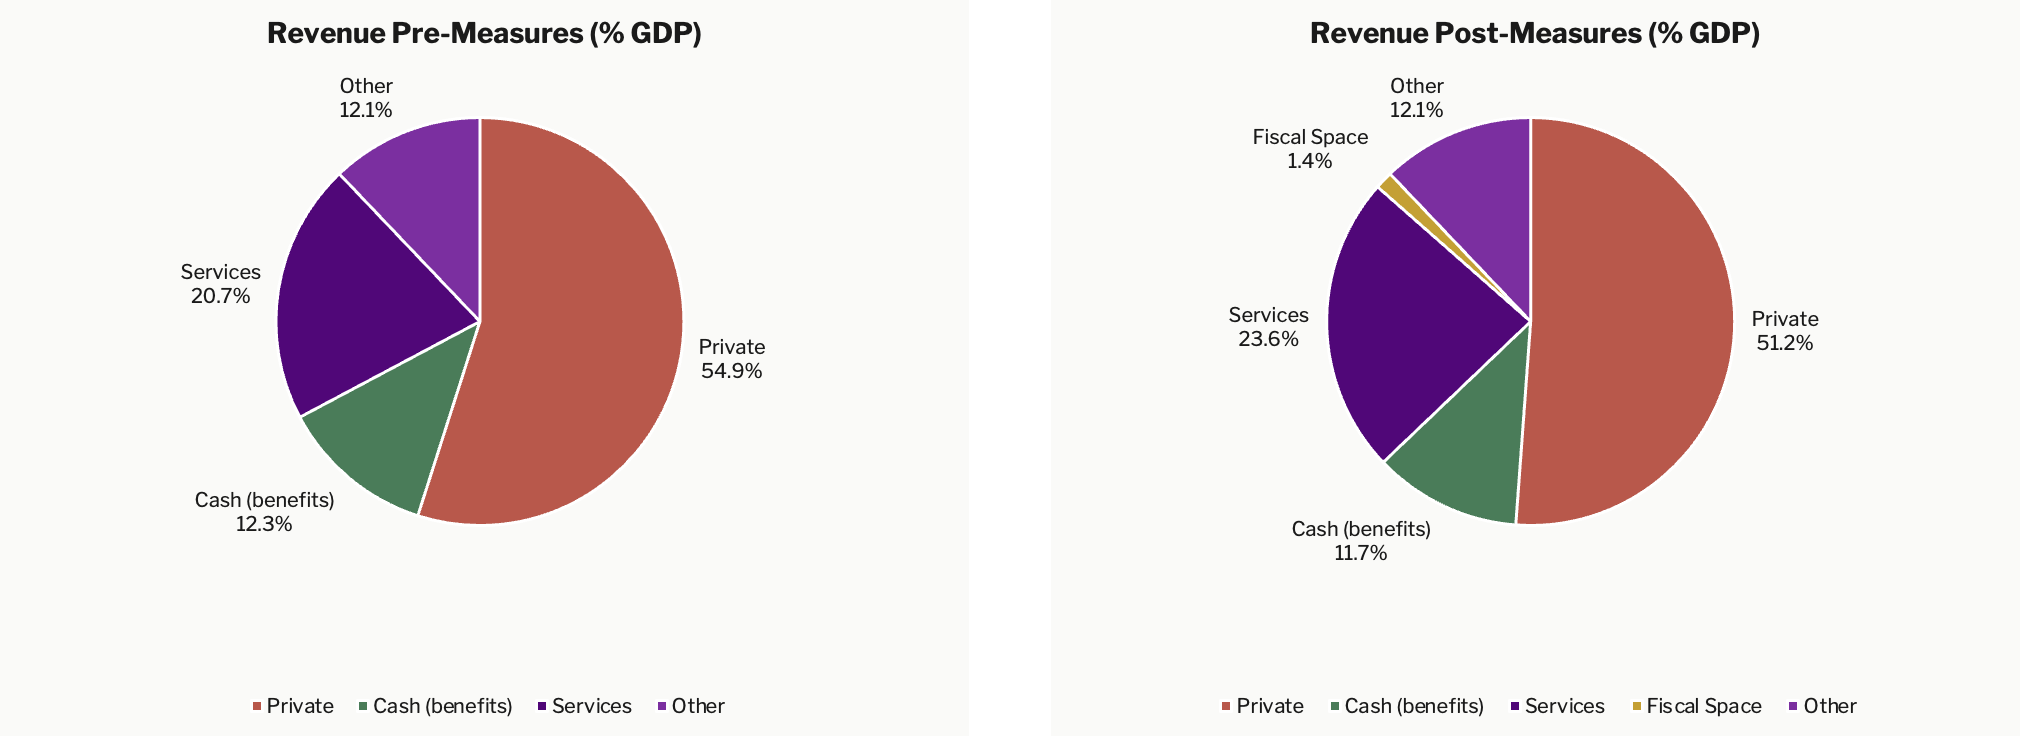
Public spending increases by 3.0% GDP, of which:
- 0.9% GDP is services that transfer household bills to central funding
- 1.6% GDP is new services
- 0.5% GDP is new capital infrastructure (transport & housing)
Budget Allocation
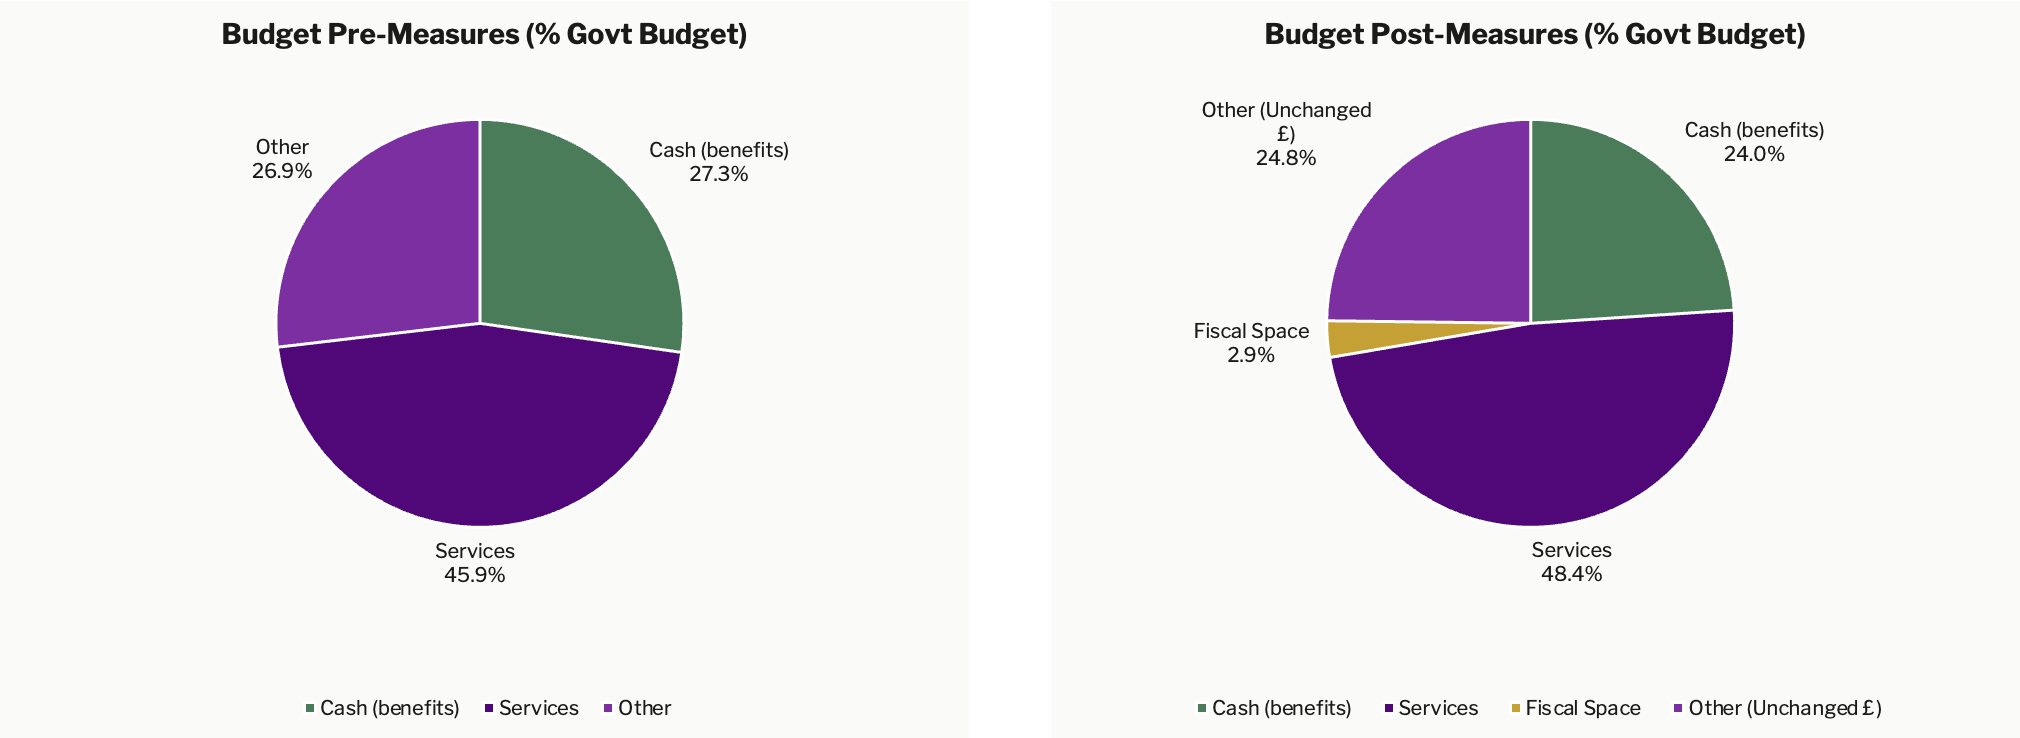
Change in budget allocations as a share of GDP:
- Services: +2.9%
- Cash benefits: –0.6%
- Other: No change (assumed continued)
- New fiscal space: +1.4%
Change in budget allocations as shares of government budget:
- Services: +2.5% (+£80B)
- Cash: –3.3% (–£16B)
- Other: –2.1% (£s unchanged)
- New fiscal space: 2.9% (+£38B)
Economic transfers
Transfers between household and state budgets as % of GDP.
- Private to public, increase in tax from private sector: –3.7%
- Intra-public reallocation: -0.6%
- Public to private, decrease in cost of living: +2.2%
- Net transfer private to public: -2.1%
The budget allocates 2.9% GDP to services and capital, but the value experienced by households is 2.2% GDP. The 0.7% difference has two components: 0.5% is infrastructure spending (energy transition, digital platforms, network investment) that benefits the economy broadly but does not directly reduce household bills; the remaining 0.2% reflects democracy and housing maintenance spending that similarly falls outside the household cost-of-living model.
Distributional Effects
For 44% of the population, the net effect is to increase disposable incomes by an average of 5%. For the remainder, the average net effect is a 3.3% reduction in disposable income. A full analysis of the distributional effects is available in the Household Effects section of this report.