
Creating and delivering a platform of de-centralised, unconditional, and interconnected services that satisfy basic human needs and enable individuals to make their contributions. Universal Services are highly responsive to each particular place and community, with universal access but not provision.
Universal Services drive down the cost of living, strengthen reciprocity, and build resilient infrastructure. These objectives are deeply interwoven. Reducing the cost of living directly strengthens reciprocity. Creating the Services also builds the social, democratic, and physical structures needed for resilience.
Universal entitlement smoothes life’s transitions, remaining reliably constant whatever a person’s circumstances: an antidote to the “benefits trap”.
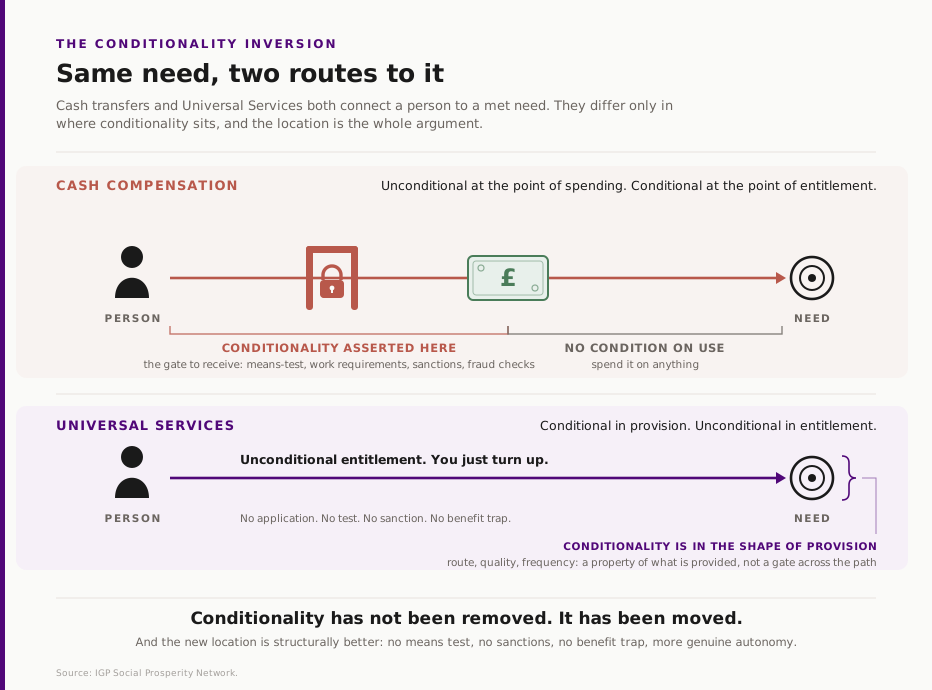
Cost of Living
Reducing the cost of living is the social side of the state’s security responsibility because the lower the cost of life, the freer the citizen can be – free to choose their path in life, free to care, free to participate. The Services enhance every type of income as much as if income itself were increased. But, in many aspects of life, the state is uniquely able to leverage collective provision to deliver more value than a citizen could on their own. The most effective areas for state action are the things we all need. The basic services that support us all, some every day and others at certain times in all our lives, are where we can act most effectively to free each other.
Universal Services are, by definition, accessible to all citizens; the more Services a citizen uses, the greater their cost of living savings. In this report, the take-up of services is varied by household and income level. This chart shows how much households that use the Services save more. In this report, those with the lower incomes (Q1) are modelled with a higher uptake of the Services.
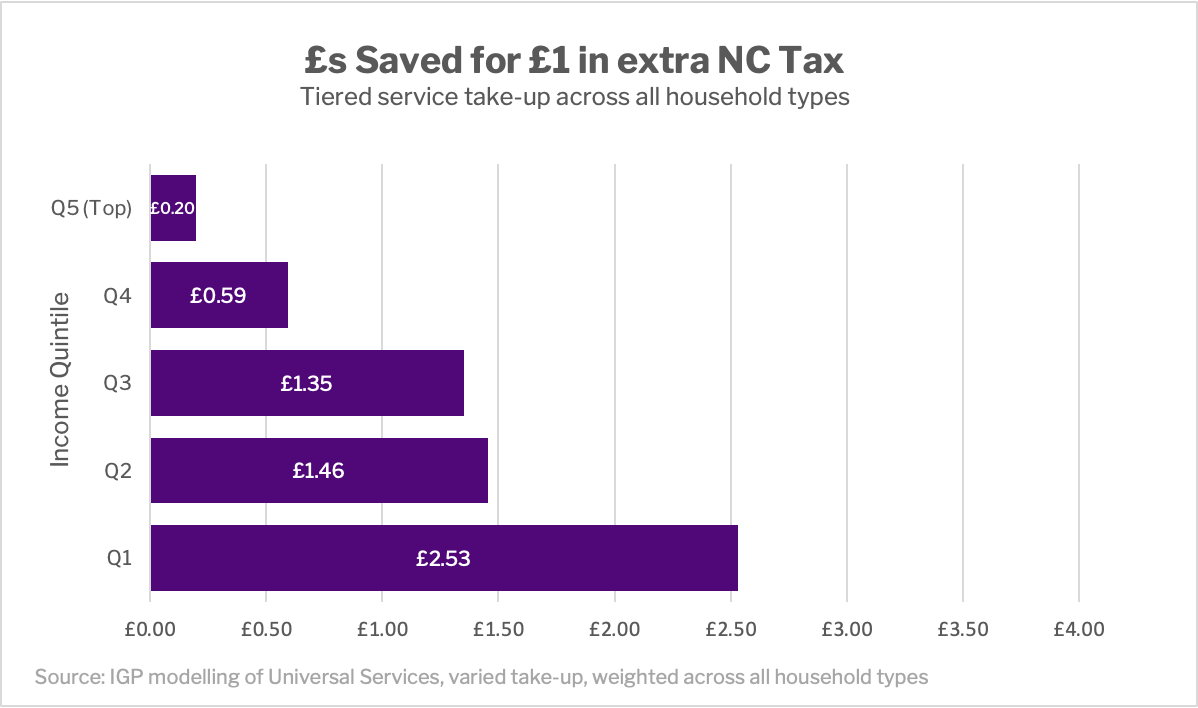
While this report models higher Service uptake in lower income households, there would be nothing preventing households with higher incomes making equal savings because access is not gated by conditionality.