
1 Policy Proposal
This appendix sets out the distributional calculations underpinning the proposal to triple Air Passenger Duty (APD), raising an additional £8 billion per annum to fund universal free local bus travel across the United Kingdom. Current APD revenue stands at approximately £4 billion (OBR, 2023/24: £3.8B actual; 2025/26 forecast: £4.6B), implying a target yield of approximately £12 billion under the tripled regime.
2 Current APD Rate Structure
APD is levied per passenger per flight, with rates varying by distance band and cabin class. The rates relevant to this analysis (2024/25 reduced, economy class) are:
| Band | Distance threshold | Economy rate | Tripled rate | Additional cost per flight |
|---|---|---|---|---|
| A (short-haul) | 0–2,000 miles | £13 | £39 | £26 |
| B (long-haul) | 2,001–5,500 miles | £88 | £264 | £176 |
| C (ultra long-haul) | >5,500 miles | £92 | £276 | £184 |
Premium economy and business/first class rates are higher; these are excluded from the central estimates but would further concentrate the burden on higher-income passengers.
3 Distribution of Flights by Income Quintile
Estimates of the share of total flights attributable to each income quintile are drawn from Büchs and Mattioli (2021), who report the distribution using both the Living Costs and Food Survey (LCF, 2006–2017/18) and the National Travel Survey (NTS, 2006–2017) for England. The LCF analysis assigns 6% of all flights to the bottom income quintile (Q1) and 42% to the top quintile (Q5); the NTS yields 10% and 40% respectively. We adopt a central estimate blending both sources, slightly weighted towards the NTS given its inclusion of business flights and individual-level data:
| Income quintile | Share of total flights (central estimate) |
|---|---|
| Q1 (lowest) | 8% |
| Q2 | 13% |
| Q3 | 18% |
| Q4 | 25% |
| Q5 (highest) | 36% |
These shares are consistent with the broader finding that approximately 50% of the UK adult population does not fly in any given year, and that 15% of the population accounts for 70% of all flights (Hopkinson and Cairns, 2021).
4 Flight Distance by Income: The Short-Haul/Long-Haul Gradient
A flat per-flight APD increase would distribute the burden in proportion to flight counts. However, APD is banded by distance, with long-haul rates approximately 7× the short-haul rate. The distribution of flight distances across income groups is therefore critical to the distributional assessment.
Büchs and Mattioli (2022) estimate flight-level CO₂ emissions using destination-country data from the UK Household Longitudinal Study (Understanding Society), applying UK Government conversion factors differentiated by domestic, short-haul and long-haul categories. They find that inequality of air travel emissions exceeds inequality of flight counts, because higher-income households not only fly more frequently but fly further on average. Their central result is that a distance-based "frequent air miles tax" is the most progressive of all air travel tax options modelled.
Banister (2018) reports that among UK adults who fly, approximately 37% take short-haul international flights and 18% take long-haul international flights, with the remainder domestic. The Civil Aviation Authority's aggregate departure data indicate that roughly 80% of UK air departures are short-haul (Band A) and 20% long-haul (Bands B and C).
Combining these sources, we estimate the following band distribution by quintile:
| Quintile | Band A (short-haul) | Band B (long-haul) | Band C (ultra long-haul) | Weighted avg. extra APD per flight |
|---|---|---|---|---|
| Q1 | ~95% | ~4% | ~1% | ~£33 |
| Q2 | ~90% | ~8% | ~2% | ~£40 |
| Q3 | ~82% | ~13% | ~5% | ~£50 |
| Q4 | ~73% | ~20% | ~7% | ~£63 |
| Q5 | ~65% | ~25% | ~10% | ~£78 |
These estimates are necessarily approximate. Q1 flyers are disproportionately taking budget short-haul flights (Ryanair, easyJet) to European leisure and VFR (visiting friends and relatives) destinations; this is consistent with the expansion of low-cost carriers driving increased Q1 participation identified by Büchs and Mattioli (2021). Q5 flyers take a substantially higher proportion of long-haul leisure and business flights, and are more likely to fly in premium cabins attracting higher APD rates (NEF, 2025).
5 Distributional Burden Estimates
Combining flight shares (3) with distance-weighted per-flight costs (4), we estimate the distribution of the additional £8 billion APD revenue across income quintiles. Per-household estimates assume approximately 28 million UK households; see 8 for discussion of the household-count-per-quintile assumption.
| Quintile | Flight share | Weighted avg. extra APD/flight | Est. share of extra revenue | Revenue (£B) | Per household (£) |
|---|---|---|---|---|---|
| Q1 | 8% | £33 | 5% | £0.40 | £71 |
| Q2 | 13% | £40 | 10% | £0.80 | £143 |
| Q3 | 18% | £50 | 16% | £1.28 | £229 |
| Q4 | 25% | £63 | 28% | £2.24 | £400 |
| Q5 | 36% | £78 | 41% | £3.28 | £586 |
The weighted average across all households is approximately £286, consistent with a cross-check against OBR aggregate data (current APD ~£160 per household; tripling implies ~£320 per household additional, with the small discrepancy reflecting rounding and the non-linear band structure). In absolute terms, Q5 households pay approximately 8× the Q1 household burden. Burden as a share of disposable income is calculated separately using household-recomposed income data (see main text).
6 Comparison: Flat Per-Flight vs. Distance-Weighted Estimates
A naïve model assuming uniform APD per flight (i.e., distributing the £8B purely by flight share) yields a substantially different — and less progressive — distributional pattern:
| Quintile | Distance-weighted per HH (£) | Flat per-flight per HH (£) | Difference |
|---|---|---|---|
| Q1 | £71 | £114 | −38% |
| Q2 | £143 | £186 | −23% |
| Q3 | £229 | £257 | −11% |
| Q4 | £400 | £357 | +12% |
| Q5 | £586 | £514 | +14% |
Incorporating flight distance reduces Q1's estimated burden by approximately 38% relative to the flat model, while increasing Q5's burden by approximately 14%. This reflects the concentration of short-haul, low-APD flights among lower-income flyers and of long-haul, high-APD flights among higher-income flyers.
7 Net Distributional Impact Including Bus Benefit
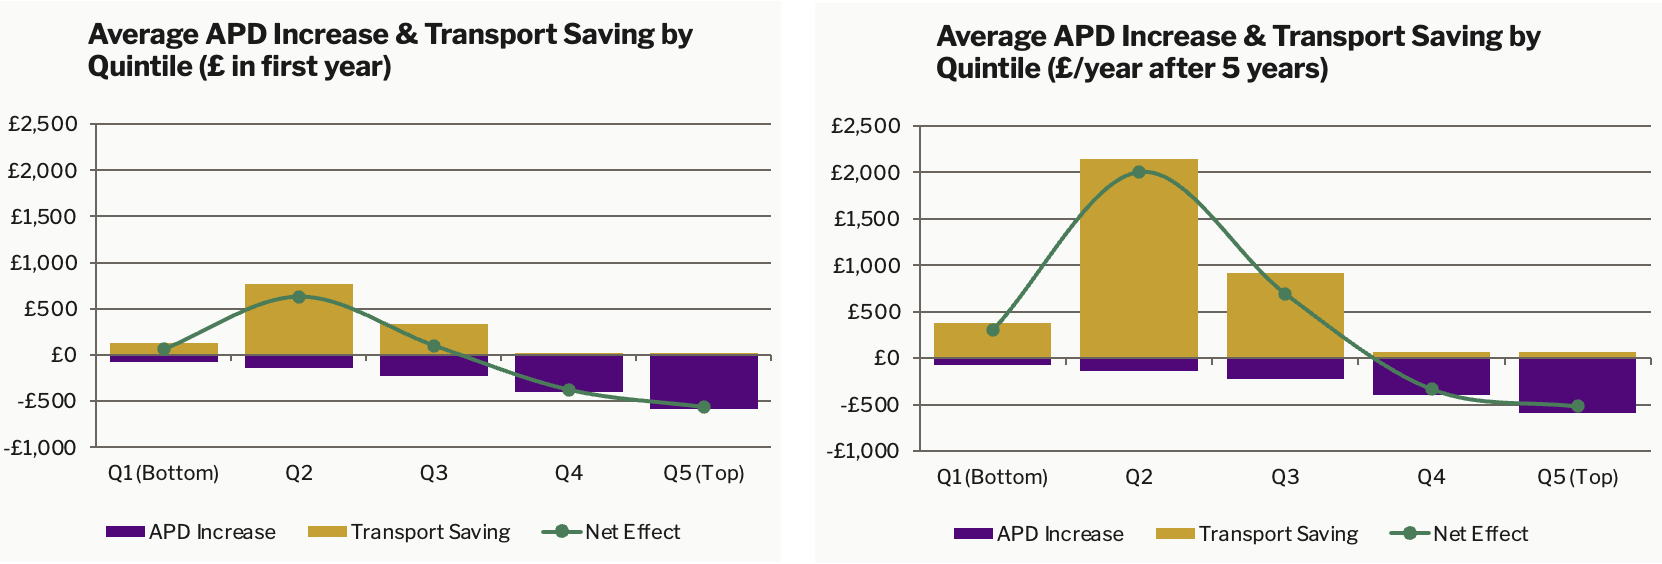
The additional £8 billion in APD revenue funds universal free local bus travel. The benefit of this provision flows disproportionately to lower-income quintiles, where bus dependency is highest. MIS 2025 data value a free bus pass at approximately £130 per month for an average adult bus user, or roughly £1,560 per annum for bus-dependent households. Even at a conservative population-average valuation, the bus benefit substantially offsets the APD burden for Q1 and Q2 households while representing a modest offset for Q4 and Q5. The net effect is strongly redistributive.
8 Caveats
Several limitations apply to these estimates. Where the direction of resulting bias can be assessed, it is noted below; in each case the bias is conservative (i.e., the true distributional pattern is likely more progressive than estimated here).
Individual-ranked versus household-counted quintiles. The flight-share data from Büchs and Mattioli (2021) and the ONS Effects of Taxes and Benefits series both rank individuals by equivalised household disposable income and divide them into quintiles of equal numbers of people. However, the per-household burden estimates in 5 assume an equal number of households per quintile (~5.6 million). This is unlikely to hold. Q1 is disproportionately composed of single-person and small households (pensioners living alone, single working-age adults), while Q5 is disproportionately composed of couples and multi-adult households. Quintiles of individuals therefore contain more households in Q1 than in Q5. The effect of this is to reduce Q1's per-household burden (dividing across more households) and increase Q5's per-household burden (dividing across fewer), making the tax more progressive than the equal-household-count assumption implies. Precise household counts per quintile require recomposition from individual-level survey data and are not reported here.
Passenger-flights versus trip-events. APD is levied per departing passenger. When a couple flies together, two APD charges arise. The LCF survey item asks about "the number of flights made by members of the household in the last 12 months," which is ambiguous between counting trip-events and passenger-flights. If respondents report trip-events (one holiday = one flight, regardless of how many household members travelled), then the flight-share estimates undercount passenger-flights for larger households. Since household size is positively correlated with income — Q5 households contain more adults on average than Q1 households — this would understate Q5's share of APD-liable departures and overstate Q1's share. The NTS data, being individual-level, avoids this ambiguity; the central estimates in 3 are weighted towards the NTS partly for this reason. To the extent any residual bias remains, its direction is conservative.
Pre-pandemic flight data The flight-share data are drawn from surveys conducted between 2006 and 2018, predating both the COVID-19 pandemic and subsequent recovery. Post-pandemic inequality in air travel may differ from these patterns; early evidence suggests that recovery in flying has been faster among higher-income groups (Büchs and Mattioli, 2021), which would if anything strengthen the progressive pattern.
Distance band estimates. The per-quintile band distributions in 4 are inferred from aggregate and emissions-based evidence rather than direct observation of per-quintile destination data, which is not publicly available at the required granularity. The CAA Passenger Survey collects both income and route data at the individual level, but the micro-data are not in the public domain. The key qualitative finding — that inequality of air travel emissions exceeds inequality of flight counts, implying higher-income flyers travel further on average — is established directly by Büchs and Mattioli (2022), but the precise band shares by quintile should be treated as illustrative.
Behavioural responses. Demand elasticity effects are not modelled. Tripled APD would reduce demand for air travel, and price responsiveness is higher among lower-income households. This would likely reduce Q1 participation disproportionately, further concentrating the residual burden on higher quintiles (NEF, 2021). The revenue estimate of £8 billion therefore assumes relatively low price elasticity of aggregate demand, consistent with the short-run evidence base.
Premium cabin surcharges. Higher and business/first class APD rates are excluded from the central estimates. Since premium cabin travel is heavily concentrated among higher-income passengers, including these would further strengthen the progressive pattern.
References
Banister, D. (2018) Inequality in Transport. Alexandrine Press, Abingdon.
Büchs, M. and Mattioli, G. (2021) 'Trends in air travel inequality in the UK: From the few to the many?', Travel Behaviour and Society, 25, pp. 92–101. doi:10.1016/j.tbs.2021.05.008.
Büchs, M. and Mattioli, G. (2022) 'How socially just are taxes on air travel and "frequent flyer levies"?', Journal of Sustainable Tourism, 32(1), pp. 62–84. doi:10.1080/09669582.2022.2115050.
Hopkinson, L. and Cairns, S. (2021) Elite Status: Global Inequalities in Flying. Report for Possible, London.
New Economics Foundation (2021) A Frequent Flyer Levy. London: NEF. https://neweconomics.org/2021/07/a-frequent-flyer-levy
New Economics Foundation (2025) Introducing: The Ultra-Frequent Flyer. London: NEF.
Office for Budget Responsibility (2024) Economic and Fiscal Outlook, various editions. London: OBR.
Office for National Statistics (2024) Effects of Taxes and Benefits on Household Income, Financial Year Ending 2024. London: ONS.